Checking in on Atlantic and Pacific Hurricanes
Here we are, a few days past the average peak of the Atlantic hurricane season, and we’ve heard barely a peep, with just six named storms (average is 10 by now) and zero hurricanes. Take a look at the Pacific, though, and it’s a different story—17 named storms, versus an average of about 13. Another way of looking at it is to use accumulated cyclone energy (ACE), a measurement of how strong and long-lasting storm winds have been. ACE shows an even more dramatic difference between the Pacific and the Atlantic this year.
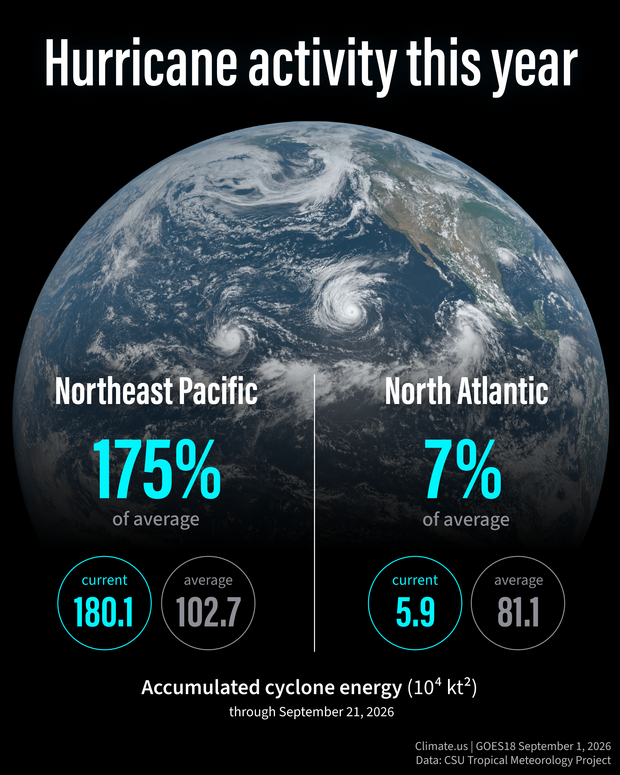
Both the Northeast Pacific and Atlantic hurricane basins are following their typical seasonal patterns during El Niño: hyperactive in the Pacific, muted in the Atlantic. As of September 21, the accumulated cycle energy (ACE) in the northeast Pacific was 175 percent of average; in the Atlantic, it was just 7 percent. Climate.us infographic based on GOES-18 satellite image from September 1 and hurricane season statistics from Colorado State University.
Here at the ENSO Blog, we’ve covered the relationship between ENSO (El Niño/Southern Oscillation, the whole El Niño and La Niña system) and hurricanes several times before. To get right to the point, El Niño tends to reduce Atlantic tropical storm activity and increase Pacific activity, while La Niña has the opposite relationship. Today, I’m going to focus on how El Niño, which happens in the tropical Pacific, affects the formation of storms in the tropical and subtropical Atlantic.
A coupled ocean-atmosphere system
El Niño is both a change in tropical Pacific ocean surface temperature and a change in the atmosphere overlying the Pacific. The average circulation over the Pacific, called the Walker circulation, consists of the trade winds (near-surface east-to-west winds), rising air over the warm waters of the far western Pacific, west-to-east winds aloft, and sinking motion over the cooler water of the eastern Pacific. This circulation is driven by two simple factors: the sun shines strongest on the tropics, and the Earth rotates.
El Niño disrupts the average Walker circulation by creating a lot more rising air over the unusually warm central and eastern Pacific. Even though the water is only a few degrees warmer, that’s a lot of extra water vapor and heat being transferred to the atmosphere in that location. It’s like moving a fountain to a different part of a pond, or a fan to a different part of a room. It changes how the whole system circulates. The Walker circulation weakens.
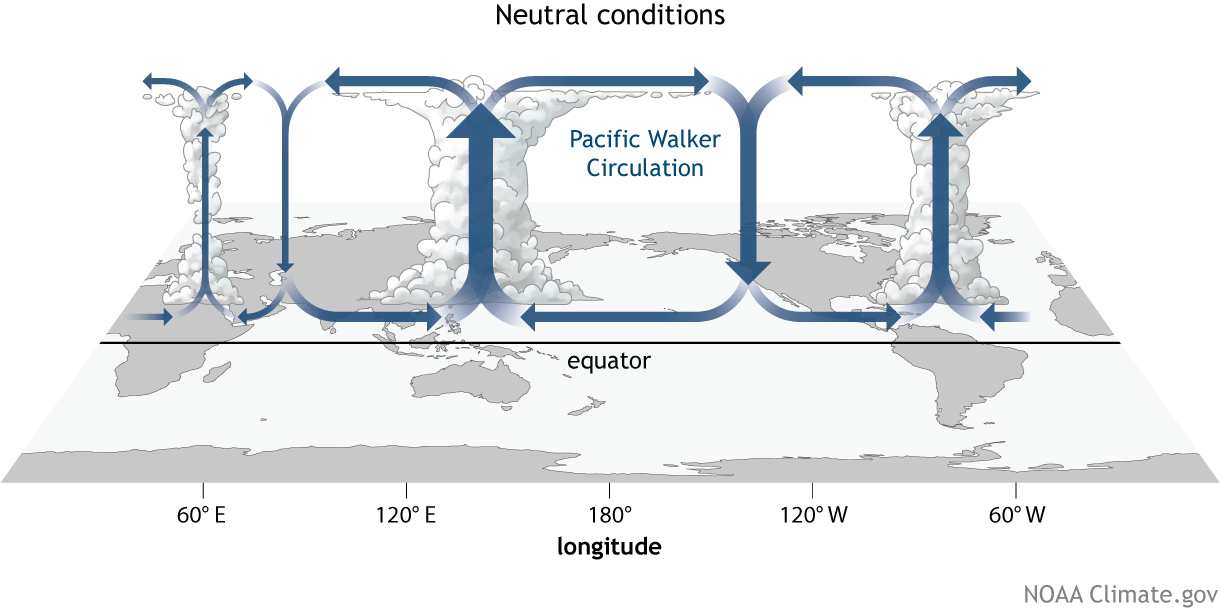
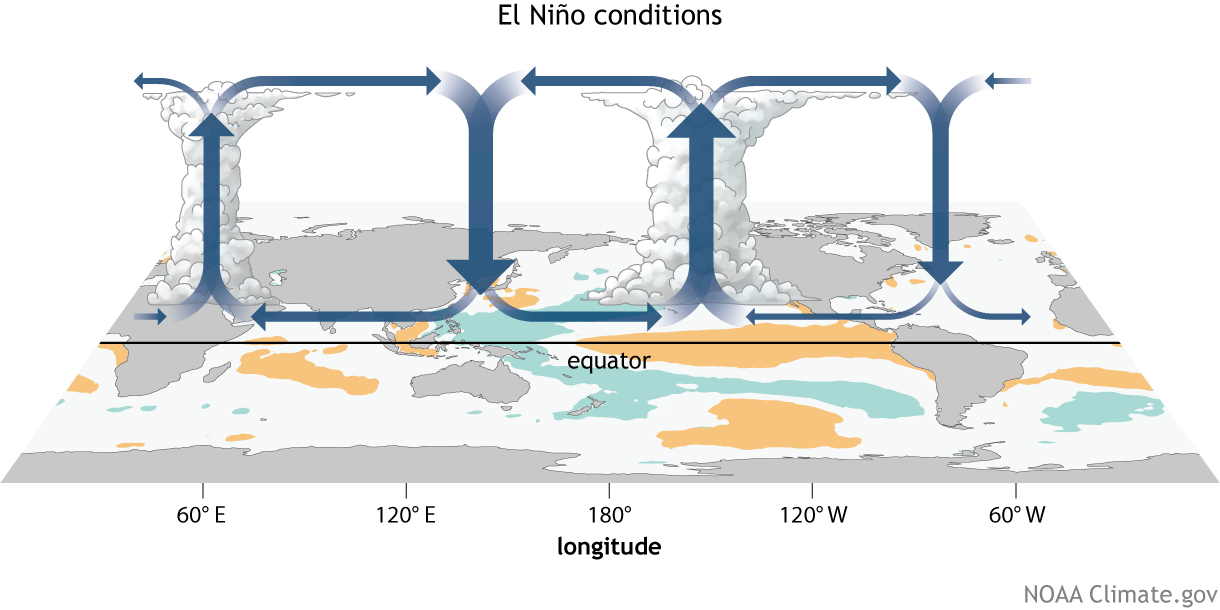
Grab and drag the slider to see how El Niño disrupts the normal Walker circulation across the tropics. View as an animated gif.
These shifts in the Walker circulation have ripple effects, leading to weather and climate changes all over the world. One of those ripples is increased upper-level winds over the Atlantic, which increases wind shear (the change in winds between the surface and high up in the atmosphere) and inhibits hurricane growth.
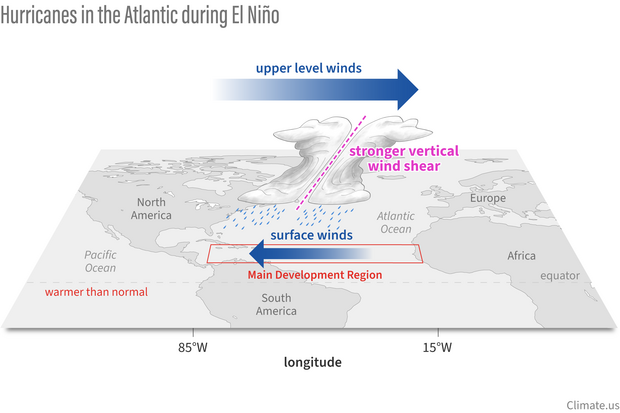
El Niño suppresses hurricane activity in the Atlantic by strengthening upper-atmosphere westerly winds. Because surface winds in the basin are easterly, the stronger upper-level westerlies increase vertical wind shear across the basin, tilting developing storms. That tilt interferes with storm intensification. Climate.us illustration.
However, in the Pacific, there’s a potent combination of more warm water, moisture, and reduced wind shear, which often leads to a more active season.
ENSO and hurricanes, by the data
If we compare the historical records of Atlantic and Pacific hurricane seasons to the strength of ENSO each year, we can see the overall effect of ENSO.
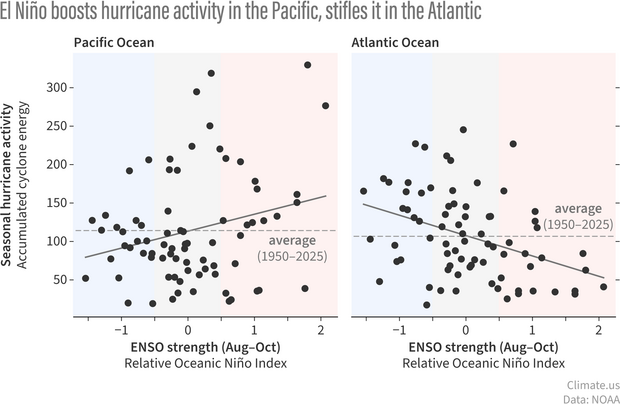
Each dot on these graphs shows seasonal hurricane activity versus the ENSO strength during August–October—the peak of hurricane season—for all hurricane seasons from 1950–2025. The higher the dot, the more active the season, as measured by the Accumulated Cyclone Energy (ACE) Index. The dashed lines show the average ACE for each basin. During El Niño years (red shading), there are more dots, meaning more seasons, above the average line than below it in the Pacific. In the Atlantic (right-hand graph), it's the opposite; more dots below average than above. Climate.us graphic, based on NOAA data.
Just like pretty much every other ENSO impact, there’s variability—the dots don’t fit right on a line. However, this relationship is reliable enough that it is the major contributor to NOAA’s annual hurricane outlook. This year, NOAA’s August update (the vast majority of hurricane activity happens after August 1, so NOAA updates the annual outlook around then) called for a 75% chance of a below-average Atlantic hurricane season, with just 5% chance of above-average. The Pacific outlook expects a 70% chance of above-average activity this year.
Feeder bands
Hurricanes are destructive and frightening, but they (and all storms) serve an important purpose in the Earth system: they “stir” the atmosphere, bringing warm air poleward from the tropics, helping to ease the difference between the tropics and the poles.
What do we know about hurricane activity and climate change? Of course, this is a complicated question, but Friend-of-the-Blog Michael Tippett provided this summary of what we understand so far about hurricanes in a warmer world: It’s pretty clear that hurricanes are bringing more rain (warmer air holds more water) and storm surge impacts are intensifying due to higher sea level. Also, there’s a fair amount of evidence that the fraction of storms that reach the most intense categories is increasing. However, it’s still unclear how the frequency of storms (number per year) may be changing, especially when you get to basin-level.
Let me leave you with a list of links for more information, and, of course, a reminder that it only takes one! Even a very quiet hurricane season can pack a wallop, so please pay attention to the forecast if you’re in a vulnerable area.
- Personal preparedness for hurricanes guide from University of Miami
- NOAA’s observations on vertical wind shear, sea surface temperature, and other fields that influence hurricane development:
- NOAA data on past hurricane seasons
- Colorado State University’s 2026 hurricane data tables
Hat tip to Matt Rosencrans for the original version of the graphs and for pointing us to the data sources!