Polar vortex takeover over the ENSO blog
No offense intended to El Niño, but I gotta say, I was pleased when I heard a couple weeks ago that models were forecasting that the polar vortex was going to weaken and produce a sudden stratospheric warming event. After several months, a person can get juuuuust the slightest bit tired of talking nonstop about El Niño, supersized or not.
Potential vorticity—how much spin a column of air has—in the Arctic stratosphere from October 6–November 5, 2026. The darkest blue areas, with the highest potential vorticity, show the polar vortex. In mid-to-late October, the stratosphere was jostled from below by a large wave in the lower atmosphere, causing the polar vortex to decelerate and then split into two lobes, triggering a sudden stratospheric warming. Climate.us animation, based on ERA5 data from Copernicus Climate Service.
I thank the atmosphere for offering this diversion, and I promise to come back next month with renewed enthusiasm for the planet’s most influential natural climate pattern. Also, I will put some highlights from NOAA’s November ENSO forecast at the bottom of the post. For now, let me quickly get you up to speed so that you can dive into this Q&A with NOAA polar vortex expert Amy Butler.
Quick-start guide to the polar vortex
The polar vortex—strong westerly winds that howl around the poles in the stratosphere of both hemispheres during their respective winters. Located 10+ miles above Earth’s surface, the polar vortexes are home to the coldest air on the planet. (Read more about how the polar vortex forms in the winter, winds down in the spring, and why it sometimes falls apart early.)
Sudden stratospheric warming—a rapid and dramatic warming of the polar stratosphere following a disruption of the polar vortex. At a pressure altitude of 10 millibars/hectopascals (around 19 miles above the surface), the average zonal (west-east) winds at 60 degrees become easterly. Stratospheric temperatures can increase by more than 50 degrees Celsius (90 degrees Fahrenheit) in a single day. Called an “SSW” for short. Some years don’t have any SSWs; some have a couple.
North Atlantic Oscillation (NAO)—a natural, large-scale seesawing of atmospheric mass and pressure between the Arctic and the mid-latitudes of the North Atlantic Ocean to the south. Constrained by geography, the atmosphere seesaws between flow states that favor strong pressure differences between the Arctic and the mid-latitudes (positive NAO) and flows that weaken those differences (negative NAO). The negative phase favors colder-than-average conditions across the eastern U.S. and Europe, and warmer-than-average conditions in the Arctic. Disruptions of the polar vortex and SSWs are often followed a week or more later by a shift to the negative state of the NAO.
Q&A with NOAA polar vortex expert Amy Butler
Q. What’s the stratosphere up to? Give us the highlights on the current event.
A. The polar vortex started off the same as it usually does. West-to-east winds formed high overhead in late August and continued to intensify throughout this fall. Then it got interesting. Usually the polar vortex isn’t disturbed this time of year. There’s not much wave activity to disrupt those west-to-east winds. But around the last two weeks of October, forecasts started showing that the vortex was about to get knocked off the pole and stretched into two smaller pieces. On November 10th, the west-to-east stratospheric winds around the pole reversed direction, marking the occurrence of a sudden stratospheric warming.
Q. Polar vortex collapses and sudden stratospheric warmings happen significantly more often in El Niño winters than in ENSO-neutral winters. Why is that?
A. El Nino drives persistent weather patterns around the globe (also known as teleconnections). These weather patterns tend to align in just the right way to amplify large atmospheric waves into the stratosphere, where they break and slow the stratospheric polar vortex down, leading to sudden stratospheric warming.
One mystery is that, while overall El Nino increases the chances of a SSW, in the last three strongest El Ninos (2015/16, 1997/98, and 1982/83), no SSW was observed. This could mean that the polar vortex behaves differently to strong El Ninos compared to more moderate ones; or it could just reflect the small sample size of strong El Nino winters.
Another mystery is that La Niña winters ALSO increase the odds of an SSW compared to a neutral year, at least in historical observations. However, while the weather patterns or teleconnections associated with La Nina can also drive more SSWs, they do so in a different way, leading to more polar vortex splits, rather than shifts of the polar vortex from the pole, compared to El Nino.
Q. Even though El Niño increases the chances for a sudden stratospheric warming, it’s weird for one to happen so early in the season. How unusual is this event, and what can we say about what might have triggered it?
A. It’s the earliest SSW in our observational record back to 1958, and not by a small amount- by more than 2 weeks. The previous record, set on 28 Nov 2025, was tied for the earliest with 1968. So it’s unprecedented to see a SSW this early.
The other unusual aspect of this event is that the polar vortex split into two pieces– a type of SSW that is much more common in La Nina winters. Moreover, El Nino typically increases SSW chances in late winter, not early winter.
So what triggered the event? The primary drivers appear to be two blocking high pressure systems- one over Alaska, another near Scandinavia- that amplified into the stratosphere and slowed the winds in these two regions, ripping the polar vortex in two. While it’s possible these features are tied to unusually strong El Nino, they are not well-known, canonical signatures of more moderate El Nino events. Further investigation will be needed to understand whether this pattern, and the early SSW, was driven by the strong El Nino or just occurred by chance.
Q. Maps of surface temperature patterns across the Northern Hemisphere following past SSWs look like the negative phase of the North Atlantic and Arctic Oscillations, with warmer-than-average temperatures in the Arctic, and cooler-than-average temperatures in the eastern U.S. and Europe. But that’s based on SSWs that have occurred mostly in mid-to late winter. Is a November event as likely to produce those same impacts?
A. In theory, yes, because the dynamics driving this SSW are not different from those driving mid-winter events. However, because we’ve never seen an event this early, we don’t really know for sure whether the impacts will be different. Even if the SSW is changing the circulation in the same way as it normally does, it’s acting on a background (or climatological) circulation that has different seasonal characteristics than a mid-winter or late winter event. For example, SSWs tend to weaken the tropospheric polar jet stream, allowing cold Arctic air to spill into the mid-latitudes. However, in early November, there may not be as much frigid Arctic air yet available to supply these cold extremes further south.
Q. We talk a lot here at the ENSO Blog about typical winter impacts of El Niño, and how El Niño favors warmer-than-average winters across the northern tier of the U.S. and cooler- and wetter-than-average winters across the South. Will this SSW favor the same impacts as El Niño, or will it undermine El Niño’s influence?
A. The impacts of this SSW may be relatively short-lived. The North Atlantic Oscillation changed to its negative phase, as expected, but is forecast to return to near neutral values for the latter half of November. The typical SSW pattern of colder than normal weather over northern Europe, Asia, and the eastern US is apparent, though somewhat muted, for the next week or two, but then disappears. Over North America in particular, El Nino seems to have a strong grip on the temperature patterns over the next month at least, driving forecasts for much warmer than normal temperatures over the northern tier of the US and cooler temperatures over the southern tier.
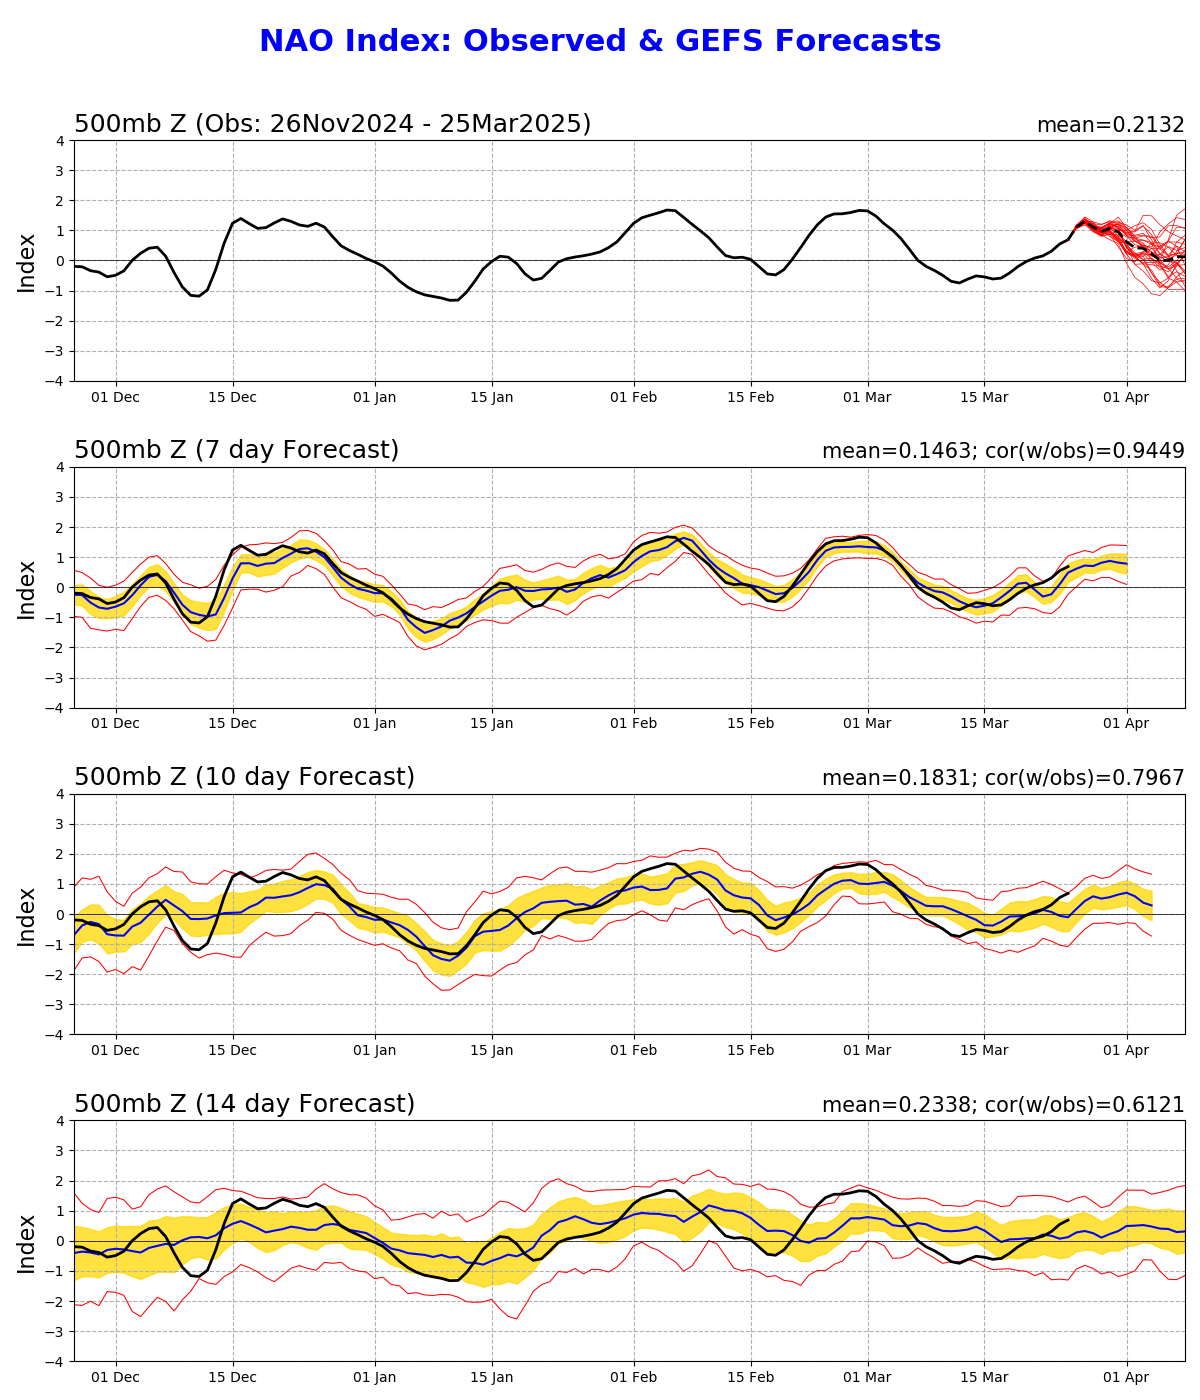
However, this may not be the only SSW this winter. Some seasonal forecasts are suggesting a high likelihood of another event, perhaps in February or early March. If another SSW were to occur, its effects could amplify El Nino impacts over Europe, Asia, and the eastern US.
#####
Ok, that's the end of polar vortex takeover. As promised, here's some highlights from NOAA's November El Niño forecast.
Highlights from NOAA’s November 2026 El Niño forecast
El Niño is barrelling along in the tropical Pacific, according to NOAA’s November 2026 forecast and discussion. NOAA puts the odds of El Niño conditions persisting through the January–March season at 100 percent—which as I have said before, is a rare thing to see in the world of climate forecasting. El Niño remains the favorite (80 percent chance) all the way through the March-May season.
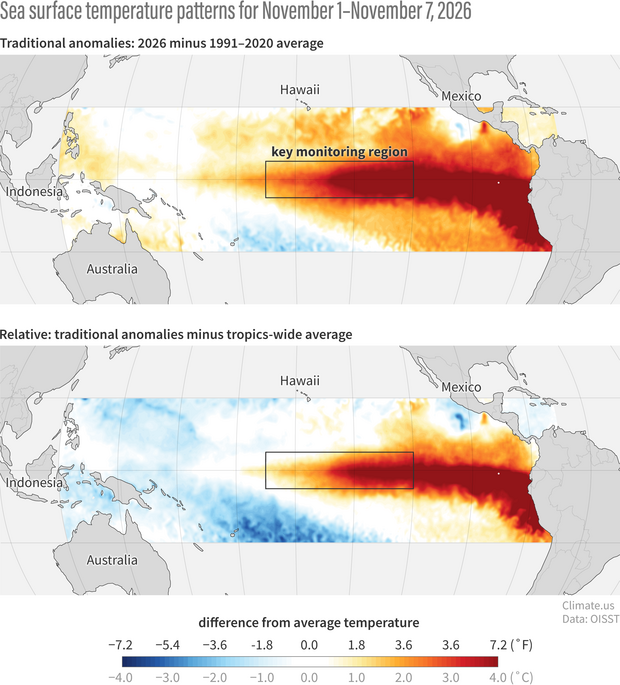
The traditional sea surface temperature anomaly (difference from average) across the tropical Pacific Ocean (top) and the anomaly relative to the whole tropics (bottom). The relative anomaly—which mitigates the influence of long-term warming of the entire tropical ocean—highlights the cool-warm contrast across the Pacific that is most important to El Niño’s influence on the atmosphere. Climate.us image, based on NOAA OISST data.
At present, the climate system is exhibiting all the tell-tale signs of a very strong El Niño:
- incredible amounts of excess heat in the upper 300 meters of the eastern Pacific at the equator,
- warm anomalies at the ocean surface (see maps above) that expanded and intensified in October (slide comparison, below),
- repositioning of towering tropical thunderstorm clouds (“deep convective clouds” to atmospheric scientists) from where they usually are (western Pacific) to where they usually aren’t (central Pacific) (see slider below), and
- weak or absent easterly trade winds + a strongly negative Southern Oscillation Index, meaning that the Walker Circulation (the giant vertical loop that usually circulates the atmosphere across the Pacific) is still AWOL.

In short, the climate is all in on El Niño! Use the sliders below to see how sea surface temperatures and cloud patterns changed between September and October.
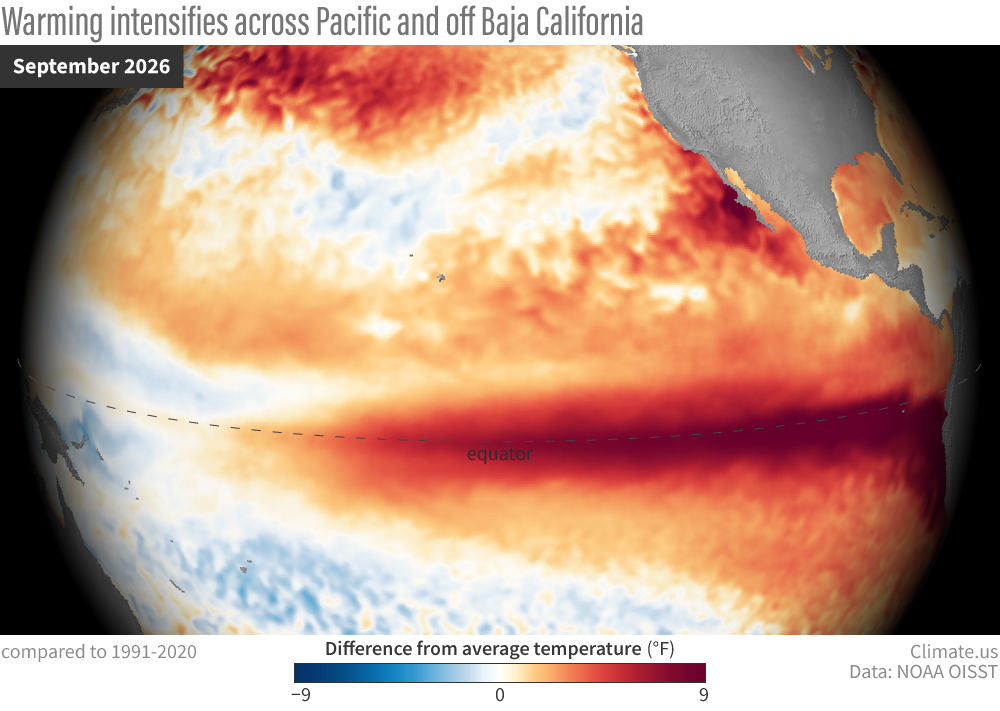
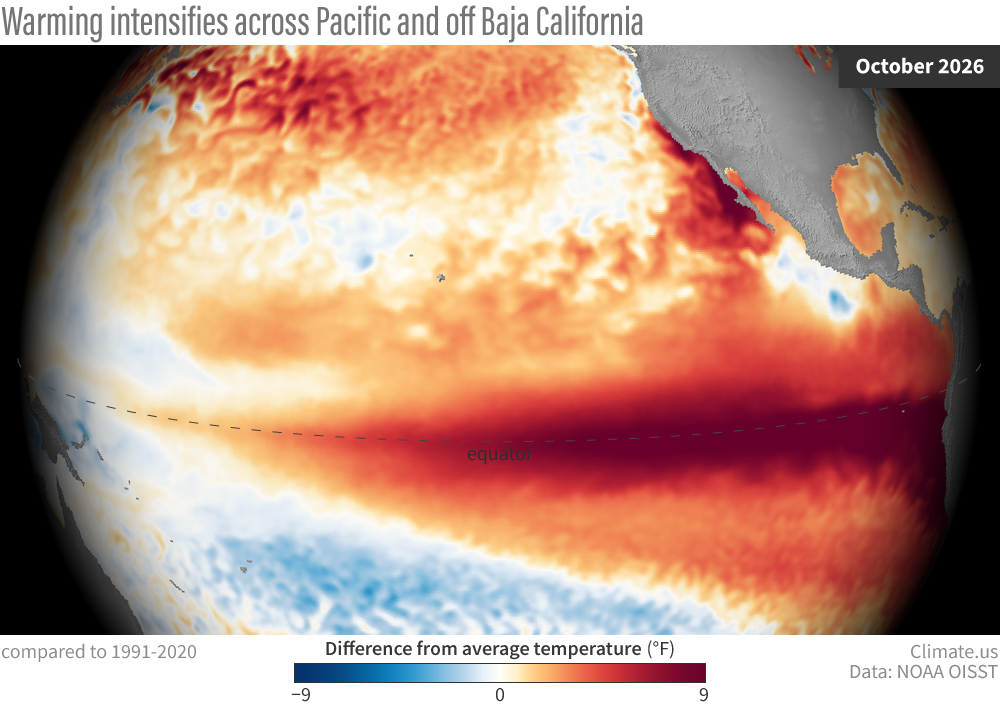
Grab and drag slider to compare sea surface temperature anomalies across the Pacific Ocean in September (left) to October (right) 2026. An even larger area of the central and eastern tropical Pacific was 9 degrees Fahrenheit or more above the 1991-2020 average in October, a sign that El Niño continued to strengthen. Climate.us images, based on NOAA OISST data.
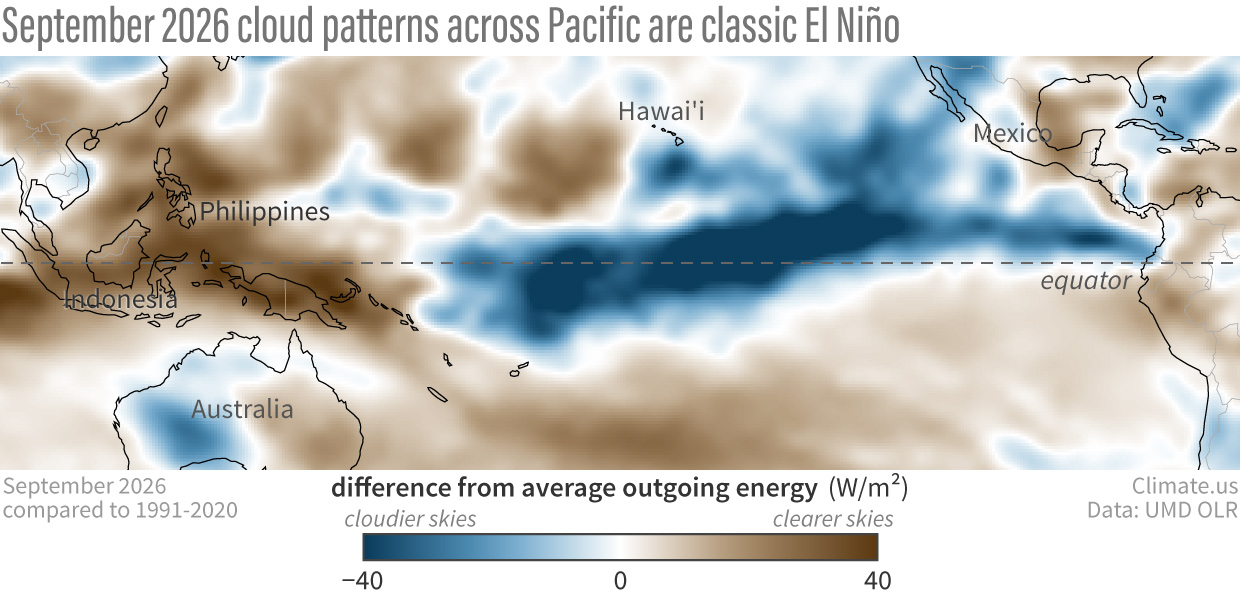
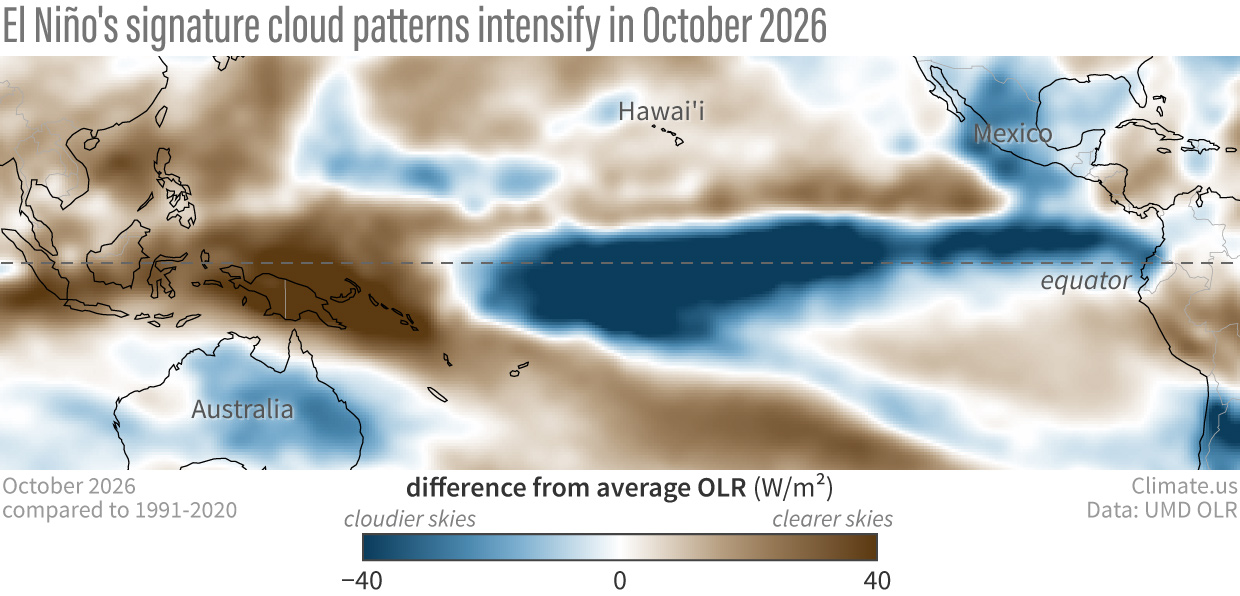
Grab and drag slider to compare the pattern of tropical thunderstorm clouds in September (left) versus October (right) 2026. The typical cloud signature of El Niño, with more tropical thunderstorm clouds in the central and eastern Pacific, and less in the western Pacific—became even more pronounced last month. Notice how the cloud patterns mirror the sea surface temperature patterns in the maps above. Climate.us images, based on outgoing long wave radiation data (OLR) from University of Maryland.
One thing I thought was interesting in the NOAA discussion and graphics was that the upper-ocean heat content anomaly—while still huge—appeared to have peaked in mid-October and was trending downward. I wondered if that was the first crack in the foundation of this El Niño. This is what Michelle L’Heureux, physical scientist for NWS's Extended Prediction Division and head of the ENSO forecasting team, had to say about it via email:
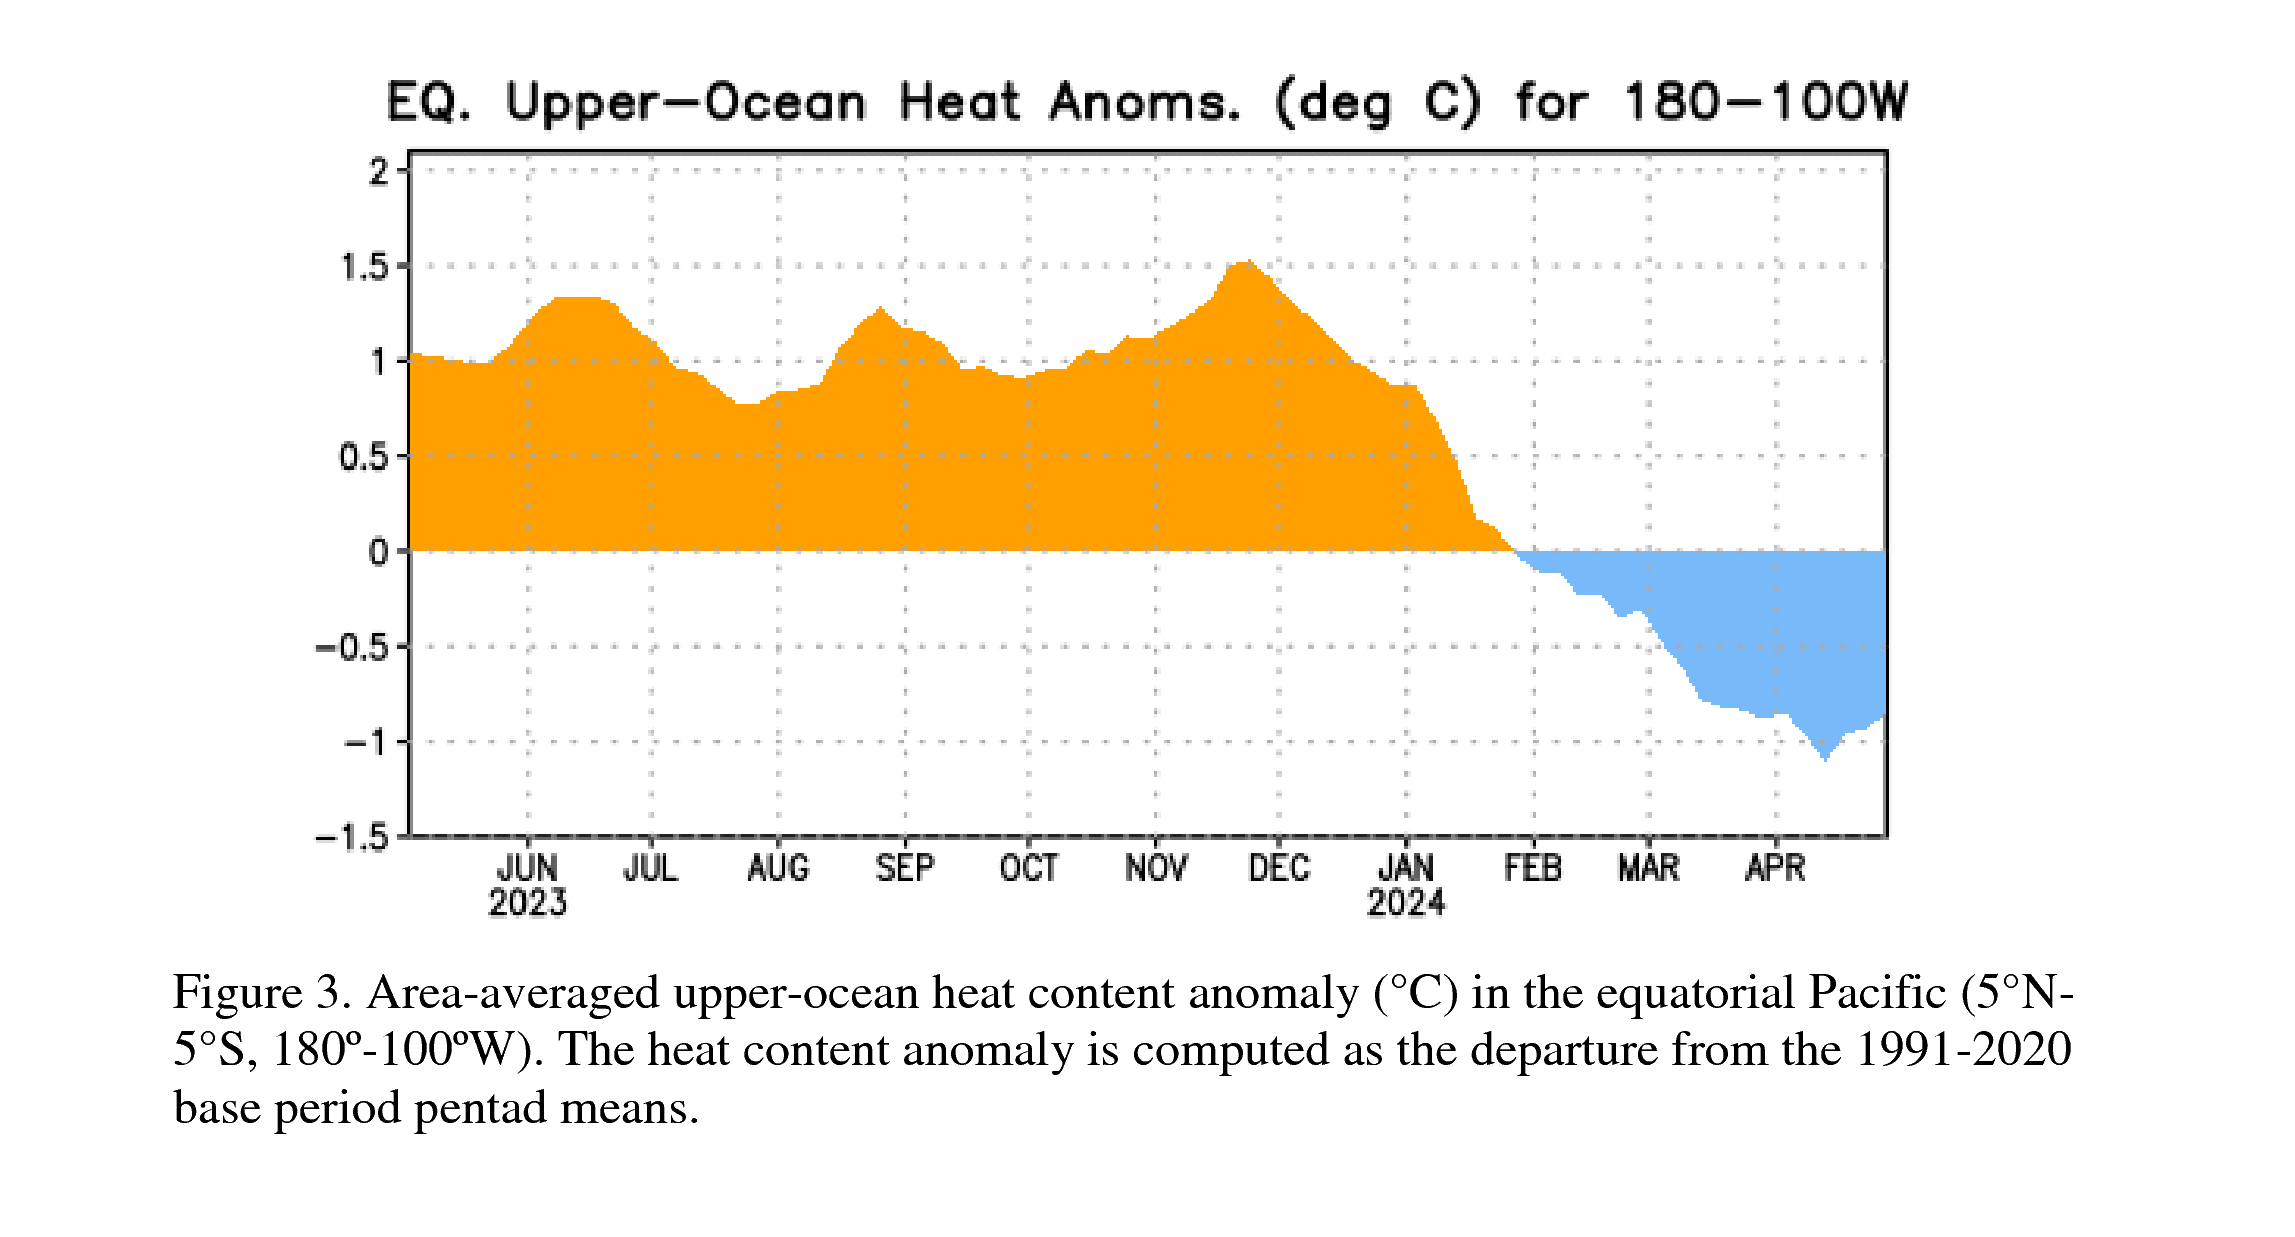
It’s hard to know exactly how meaningful the recent upper ocean heat decrease is because there is a LOT going on with the ocean and atmosphere across the tropical Pacific at the moment. In late October, we saw the westerly wind anomalies weaken, which means the winds temporarily became stronger along the equator, blowing from east to west. That likely caused the sea surface temperatures in the east-central equatorial Pacific to decrease a bit (think of how the surface of your hot drink cools when you blow on it). We are also seeing very heavy rainfall and storms on the equator, stretching from the International Date Line to South America. This is a hallmark of a very strong El Nino, but it (somewhat counterintuitively) has the effect of cooling the ocean because it blocks incoming solar radiation.
Basically there is a meteorological war going on right now between the tropical Pacific ocean and the overlying atmosphere with some features actively trying to cool the ocean (we call them negative feedbacks) and others continuing to keep it warm (we call them positive feedbacks). As the El Nino matures in the next month or so, we will likely see the negative feedbacks gain the upper hand and that will be the beginning of the end of this El Nino. Regardless, it is currently an impressive event, ranked #2 in our historical record so far with a ~60% chance that it will become stronger than all other events dating back to at least 1950.
And, yes, sometimes we have seen the negative feedbacks get interrupted and the cooling will slow or halt, but at the moment the ENSO team believes we will see a slow decay and possible return of ENSO-neutral around April-June 2027 (61% chance).
Reviewed by Emily Becker and one anonymous reviewer.