Climate variability: Relative Oceanic Niño Index
This page was last updated on Climate.gov in 2025. Climate.us updates began in June 2026.
The Relative Oceanic Niño Index (RONI) is NOAA's primary indicator for monitoring the ocean part of the seasonal climate pattern called the El Niño-Southern Oscillation, or “ENSO” for short. (The atmospheric part is monitored with the Southern Oscillation Index and other indicators.) RONI tracks the running 3-month average sea surface temperatures in the east-central tropical Pacific and indicates whether temperatures there are warmer or cooler than the tropics as a whole.
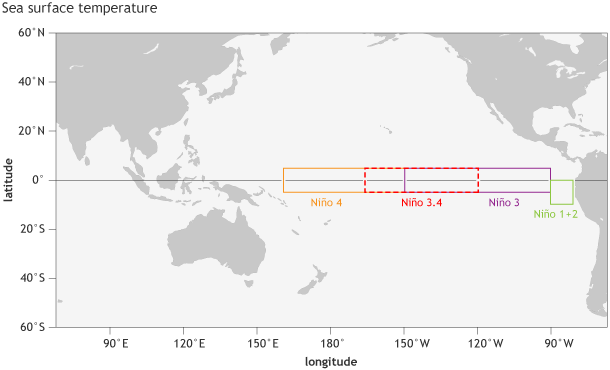
Location of the parts of the tropical Pacific used for monitoring sea surface temperature. The sea surface temperature in the Niño3.4 region, spanning from 120˚W to 170˚W longitude, when averaged over a 3-month period, forms NOAA’s official Oceanic Niño Index (the ONI). NOAA Climate.gov image by Fiona Martin.
NOAA considers El Niño conditions to be present in the ocean when the RONI is +0.5 or higher, meaning surface waters in the east-central tropical Pacific are 0.5 degrees Celsius (0.9 degrees Fahrenheit) or more warmer than the tropics-wide average. Oceanic La Niña conditions exist when the RONI is -0.5 or lower, indicating the region is 0.5 degrees Celsius or more cooler than the tropical average.
ENSO phases
El Niño brings warmer-than-average waters to the central and eastern tropical Pacific, sometimes all the way to the coast of South America. At the surface, the prevailing easterlies (the trade winds) slow down, or sometimes even reverse. The Walker Circulation weakens; convection (rising air motions) and rainfall increase in the central-east tropical Pacific and decrease over Indonesia and the western Pacific. For NOAA to declare El Niño underway, both parts of the pattern—the warmth in the ocean and the weakened Walker Circulation—have to be present.
La Niña brings cooler-than-average waters to the central and eastern tropical Pacific, again, sometimes all the way to South America. The prevailing easterlies (the trade winds) intensify. The Walker Circulation strengthens; convection (rising air motions) and rainfall increase in the central-east tropical Pacific and decrease over Indonesia and the western Pacific. For NOAA to declare La Niña underway, both parts of the pattern—the cooling in the ocean and the stronger Walker Circulation—have to be present.
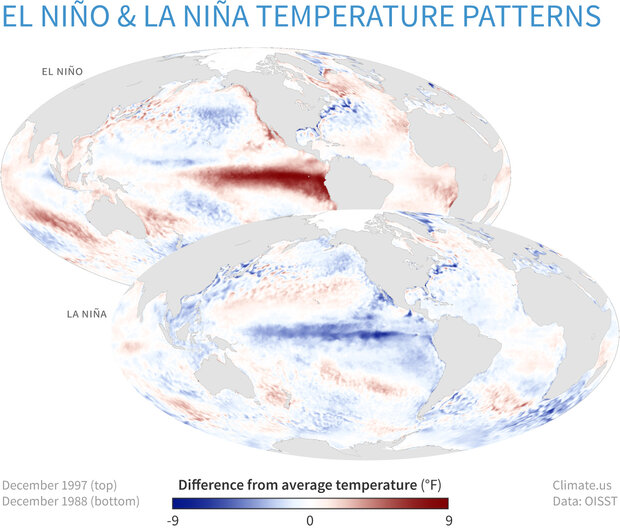
Sea surface temperature across the tropical Pacific Ocean in December 1997 (top), during a strong El Niño, and in December 1988 (bottom) during a strong La Niña. The ONI only tracks the temperatures in the Niño3.4 region, but during strong events, the entire central and eastern tropical Pacific will generally become warmer or cooler than average. Maps by Climate.us, based on data from NOAA's Physical Science Lab.
Neutral means neither El Niño nor La Niña conditions are present. Sometimes neutral genuinely means that conditions in both the ocean and the atmosphere are near average. But other times, the conditions for El Niño or La Niña have been met in the ocean, but not in the atmosphere. This half-way state is still considered neutral because unless the ocean and atmosphere are fully in sync (experts say "coupled"), El Niño and La Niña can't reach their full, climate-disrupting potential.
Monitoring and forecasting ENSO
To monitor ENSO, scientists from NOAA's Climate Prediction Center track surface temperature in the Niño 3.4 region, using in-ocean measurements from a variety of sources, including autonomous floats, moored buoys, and ship cruises. Additional information comes from satellite observations of sea surface temperature and sea level height.
ENSO is a seasonal-scale climate pattern, not something that changes from day to day or week to week. So scientists blend daily or weekly observations into a single monthly average and then average that month with values from the previous and following months. Any 3-month period—June-July-August, July-August-September—is a season. The seasonal average is compared to the 1991-2020 average. This difference from average, or anomaly, is known as the Oceanic Niño Index (ONI).
The Oceanic Niño Index was the official NOAA metric for tracking the ocean part of ENSO until early 2026, when they added a new final step to the analysis. After calculating the sea surface temperature anomaly in the central tropical Pacific (the traditional ONI), they subtract the anomaly for the whole tropics. This new index reveals not just how warm or cool temperatures in the tropical Pacific are compared to average, but how warm or cool they are relative to the whole tropics. The new index is called the Relative Oceanic Niño Index (RONI).
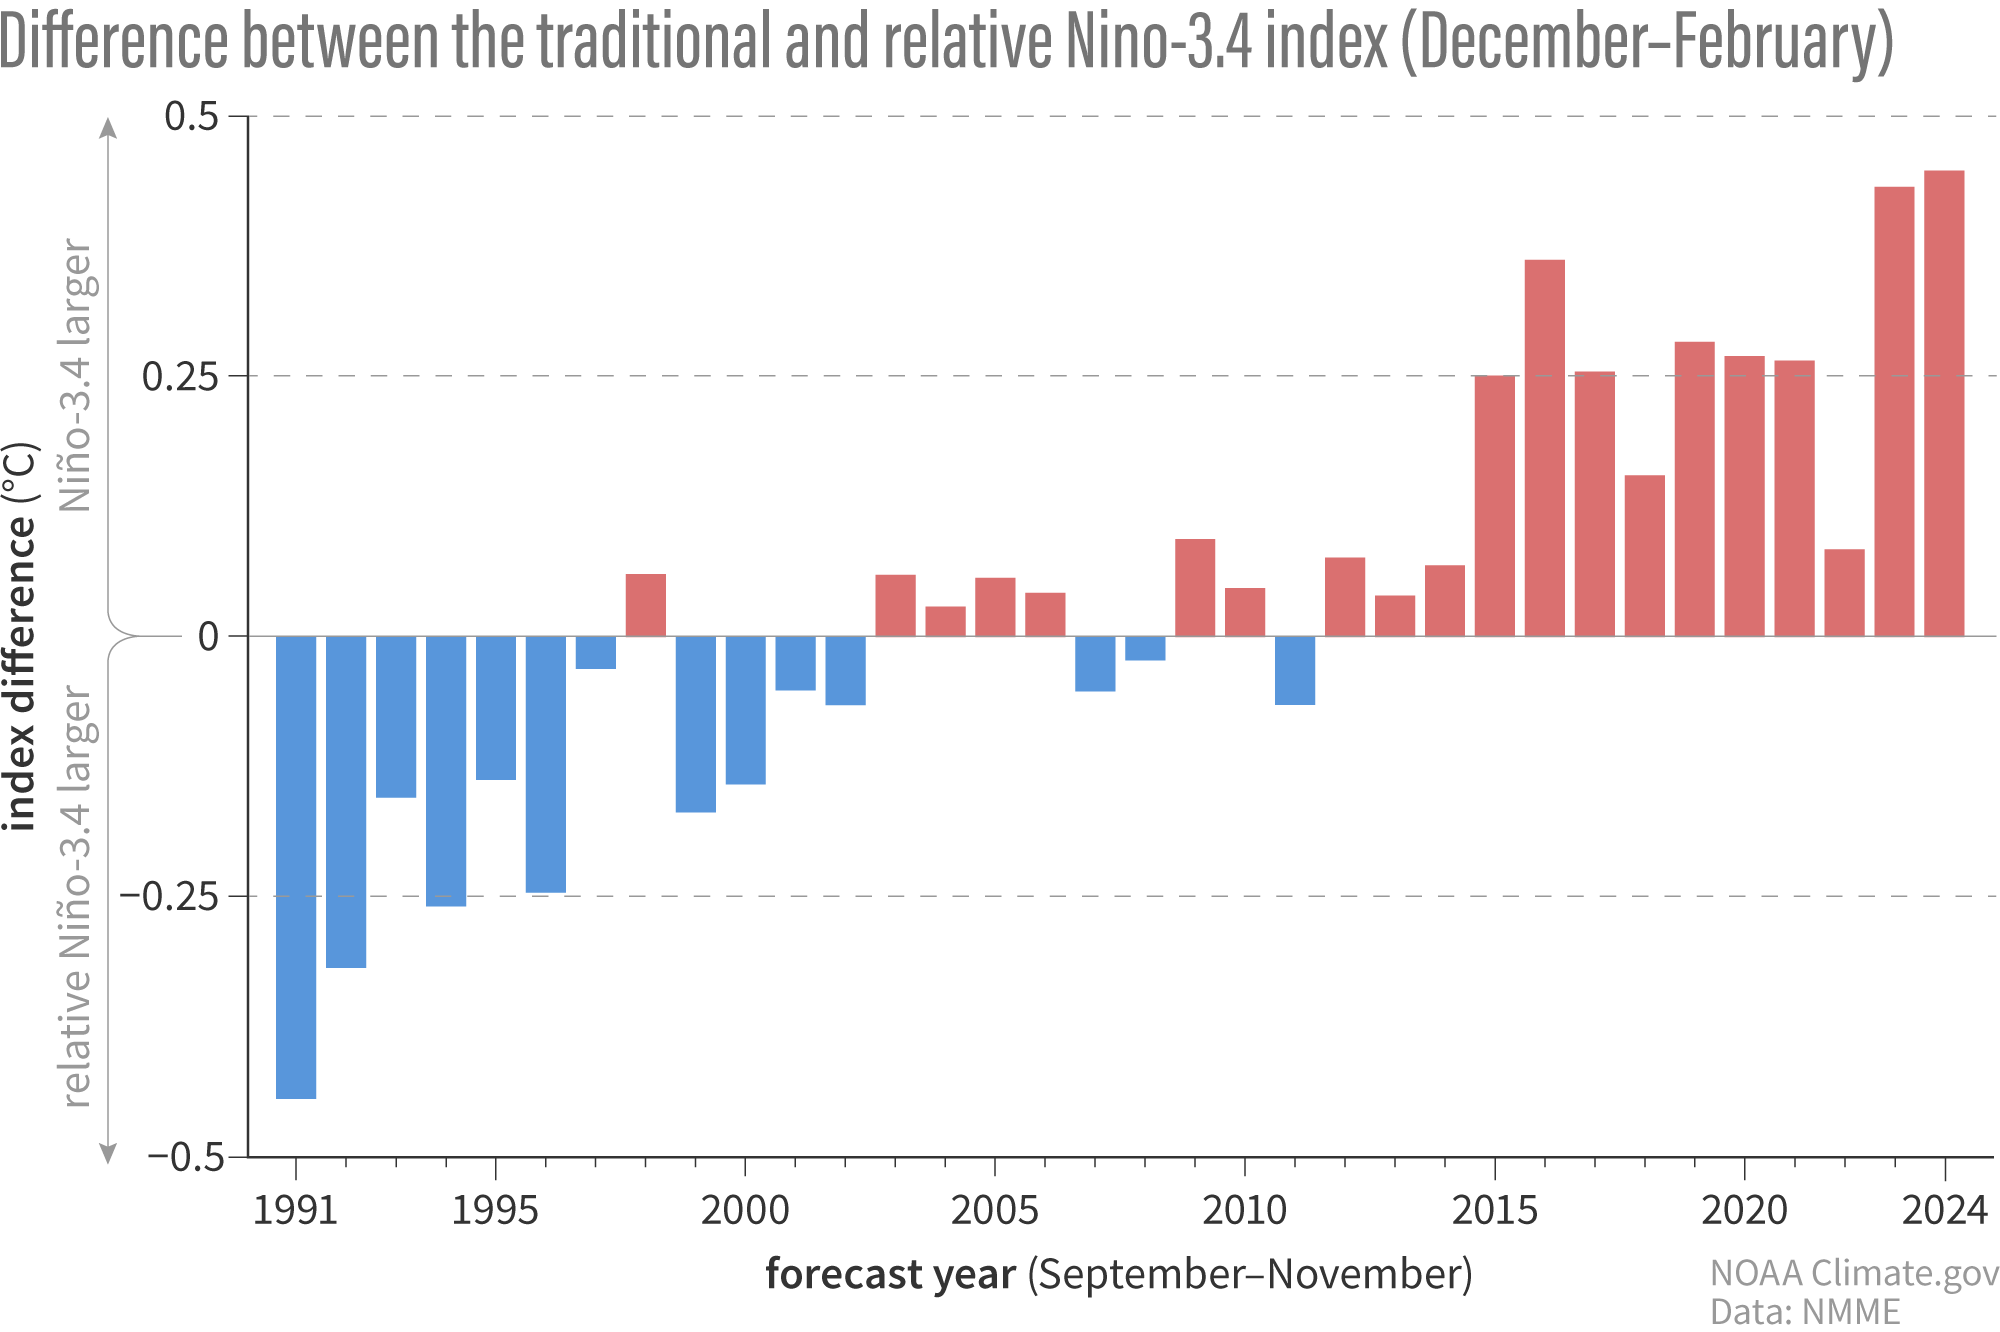
The difference between the forecasted traditional and relative Niño-3.4 index for all winters (Dec – Feb) from 1991-2024 from all NMME forecasts issued between September and November. Because the global tropics have been warming continuously during this period, an increase in temperature in the Niño-3.4 region is more commonly accompanied by an increase in temperature in the surrounding oceans, so the relative temperature difference between the Niño-3.4 region and surrounding tropics is decreasing. Therefore, the traditional Niño-3.4 index has been consistently higher than the relative index.
ENSO in the global warming era
RONI deals with the complications of monitoring and predicting ENSO in the global warming era. If your main metric for tracking El Niño and La Niña is how temperatures compare to the long-term average, then what do you do if the long-term average is warming? All recent El Niños are going to look stronger than they are. La Niñas will look weaker.
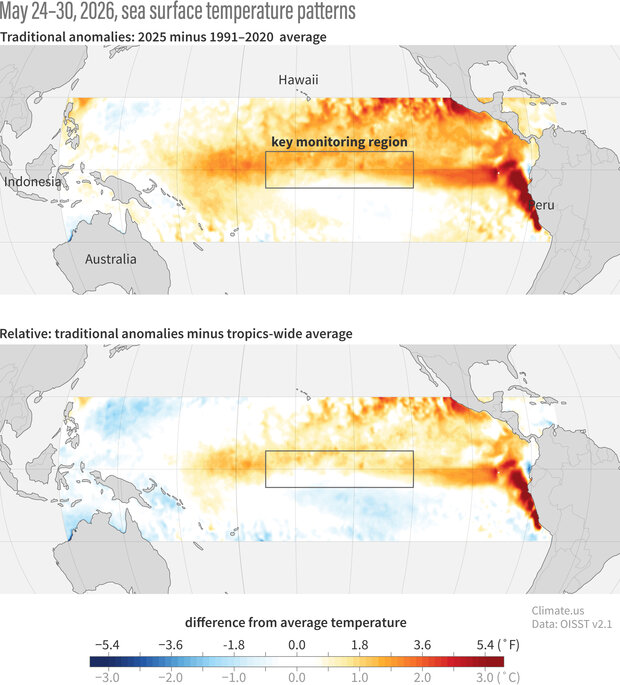
(top) A traditional anomaly, showing temperatures from May 24-30, 2025, compared to the 1991-2020 average. (bottom) A relative anomaly, showing the traditional anomaly minus the tropics-wide average. This extra step makes it more obvious that waters in the key ENSO-monitoring region were warmer than the tropical average (orange), while the water temperatures in the western Pacific were cooler than the tropical average (light blue). The relative temperature difference between one part of the tropics and another is what is most important to tropical rainfall and overall atmospheric flow. Climate.us image, based on NOAA OISST data.
It's a complication NOAA has been working on for more than a decade. The first official adaptation involved switching from a single 30-year average for all events to a custom 30-year average for every 5-year period. RONI gets around the warming trend altogether by focusing on what matters most to the emergence and intensification of El Niño and La Niña: temperature differences between one part of the tropics and another.
Why that matters is the stuff of many an ENSO blog post. For example, here, here, and here. But in brief, it’s because the large-scale atmospheric circulation in the tropics runs on gradients—the relative difference in temperature between one part of the tropics and another. RONI translates plain anomalies into the language ENSO speaks, which is relative anomalies.
ENSO beyond the tropics
ENSO shifts irregularly back and forth between El Niño and La Niña every two to seven years. Each phase triggers predictable disruptions of temperature, precipitation, and winds in the tropical Pacific Ocean. These changes disrupt the large-scale air movements in the tropics (the Walker Circulation), which triggers a cascade of global side effects.
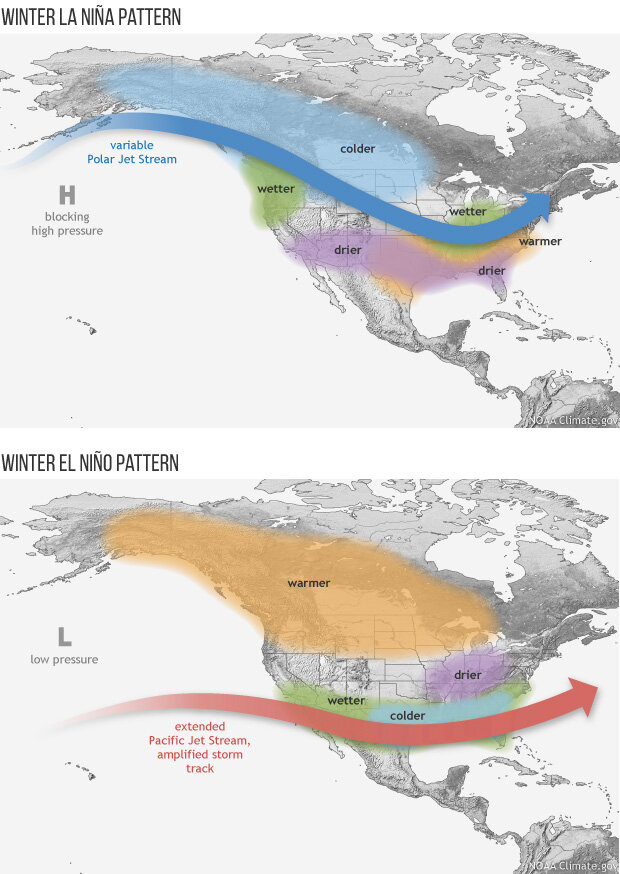
During El Niño winters, northwestern North America is more likely to experience warmer-than-average temperatures, and the southeastern U.S. is more likely to receive more rain than average. La Niña often brings the opposite. Because the mid-latitudes are farther removed from the "main event" in the tropical Pacific, however, the impacts in the United States are not as consistent, and they can be overpowered by other climate influences.
Neither phase has a strong influence on temperature or precipitation across the contiguous United States in the summer months. But El Niño tends to increase hurricane activity in the Eastern Pacific and decrease activity in the Atlantic. La Niña conditions favor the reverse: less active Eastern Pacific hurricane seasons and more active Atlantic seasons.
Further Reading
- Climate.gov ENSO Blog
- Frequently asked questions about El Niño and La Niña
- NOAA's ENSO alert system
- Popular ENSO images