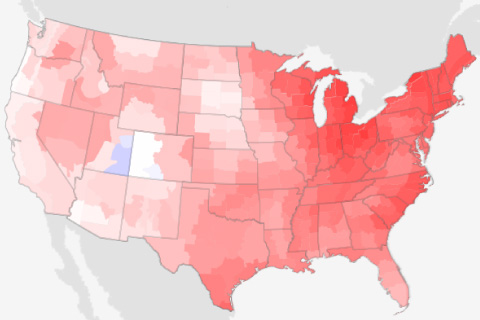
Although exact temperatures varied by latitude and elevation, January 2020 temperatures were above average for nearly every U.S. climate division of the Lower 48 states.
Although exact temperatures varied by latitude and elevation, January 2020 temperatures were above average for nearly every U.S. climate division of the Lower 48 states.
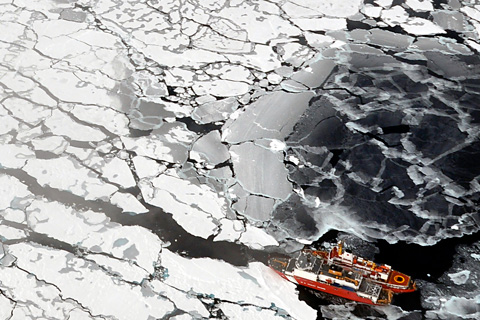
NOAA’s 14th Arctic Report Card recounts the numerous ways that climate change continues to disrupt the polar region, including massive melt of the Greenland ice sheet and major shifts in the distribution of commercially valuable marine species.

Edited by NOAA scientists, the new report reveals scientists' advancing ability to quantify human imprint in climate.
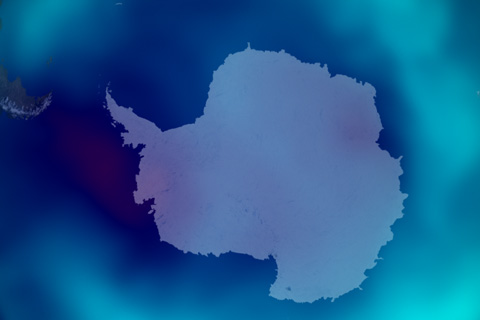
The seasonal Antarctic ozone hole was the smallest on record in 2019, thanks to a warmer-than-average September.
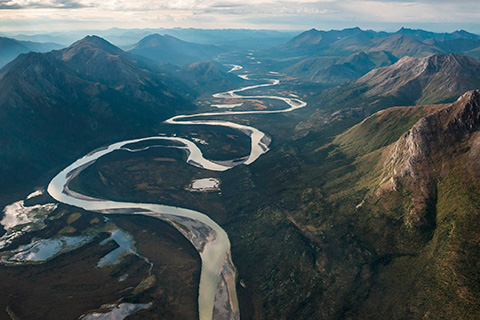
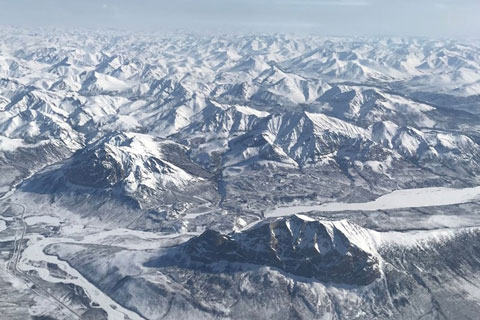
Alaska's natural monuments are of such gargantuan scale that the environment can seem immutable. But a new report from NOAA's Alaska RISA team documents profound changes the state has experienced in just the past five years.
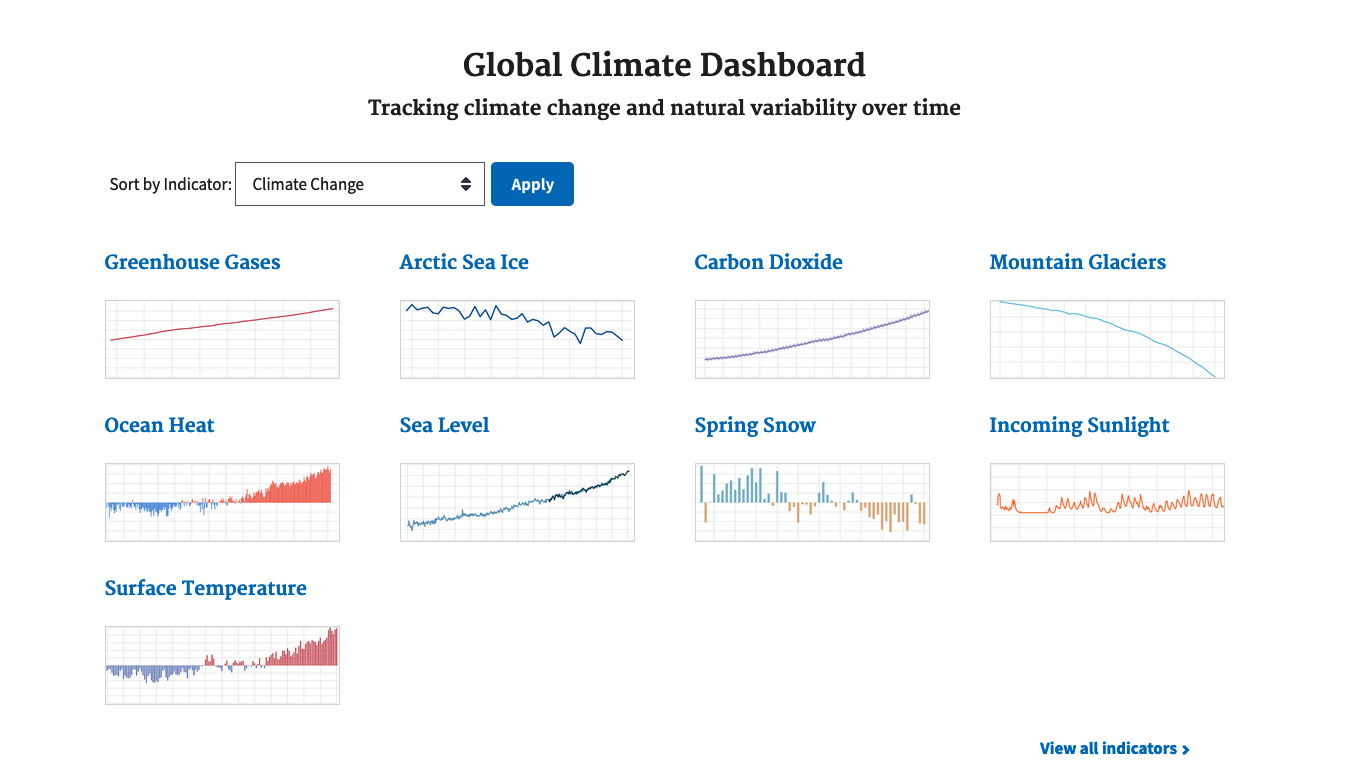
The Global Climate Dashboard provides one-stop access to information, maps, and graphs of key indicators of our global climate. Interactive graphs provide a system-wide view of the state of natural patterns like El Niño and the Arctic Oscillation and those linked to human-caused climate change, such as sea level rise and greenhouse gases.
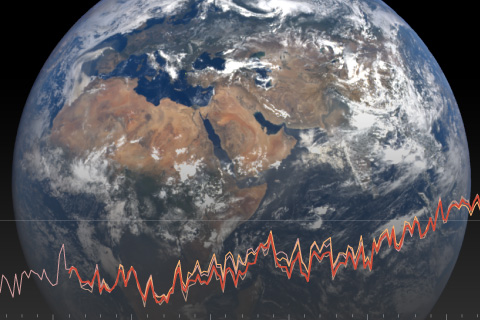
International, authoritative climate report states 2018 was the fourth warmest year on record.
From declining reindeer populations to a younger, thinner ice pack, here are four image-based stories from the 2018 Arctic Report Card.
From heat waves to heavy rain, the National Climate Assessment's recently updated collection of indicators shows how climate is changing.
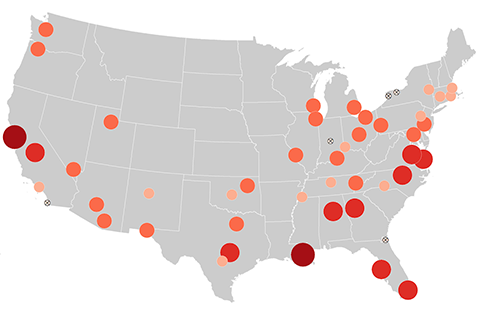
Costly and inconvenient, high-tide flooding of coastal communities is on the rise. Thanks to higher water levels from El Niño and sea level rise, the number of high-tide flood days in 2018 is projected to be 60% higher this year than would have been common around 2000. Find out what's predicted for your city in this interactive map.