Highlights from 'State of the Climate in 2025'
This press release text is by the American Meteorological Society. The graphics and captions are by Climate.us.
####
According to the 36th annual State of the Climate report, greenhouse gas concentrations, global sea level, and ocean heat content all reached record highs in 2025.
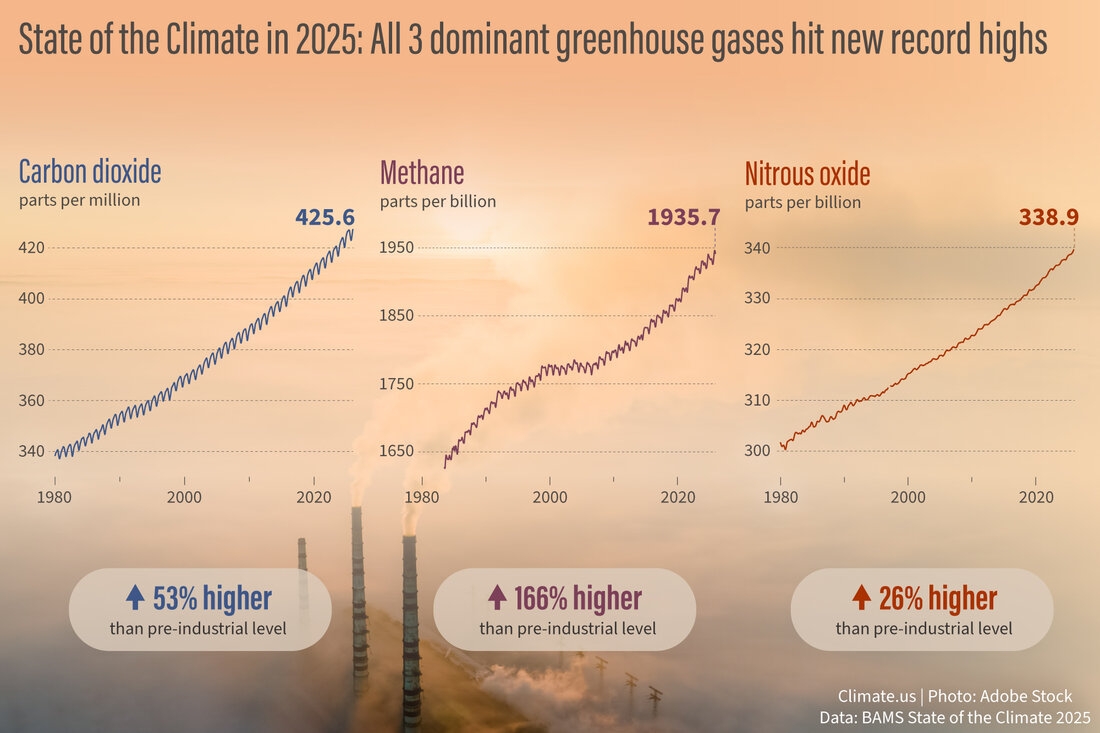
The three dominant greenhouse gases in Earth's atmosphere—carbon dioxide (left), methane (center), and nitrous oxide (right)—all reached new highs in 2025. Climate.us image, adapted from Figure 2.61 in the BAMS State of the Climate in 2025. Background photo from Adobe Stock.
The international annual review of the world’s climate, published by the American Meteorological Society (AMS), is based on contributions from 625 scientists in 60 countries. It provides the most comprehensive update on Earth’s climate indicators, notable weather events, and other data collected by environmental monitoring stations and instruments located on land, water, and ice, as well as in space. The report is published as a supplement to the Bulletin of the American Meteorological Society (BAMS).
“The State of the Climate is a comprehensive, collaborative international effort to assess annual metrics for the atmosphere, oceans, and cryosphere,” says AMS President Alan Sealls. “It’s peer-reviewed data that paints a global picture of where we are, compared to benchmarks, and how fast things are changing. Consider it analogous to your annual health assessment from your physician. The State of the Climate connects to the health of all ecosystems. It presents critical measurements and trends which inform agencies, communities, businesses, and individuals for long-term planning."
Notable findings from the international report include:
- Earth’s greenhouse gas concentrations were the highest on record. Carbon dioxide (CO2), methane, and nitrous oxide—Earth’s major atmospheric greenhouse gases—once again reached record-high concentrations in 2025. The globally averaged CO2 level reached 425.6±0.1 parts per million, a 53% increase from the preindustrial level of ~278 ppm. Fossil fuel emissions in 2025 were also a record high in 2025, estimated to be 10.3±0.5 petagrams of carbon per year, more than three times the 3.0±0.2 petagrams of carbon per year in the 1960s.
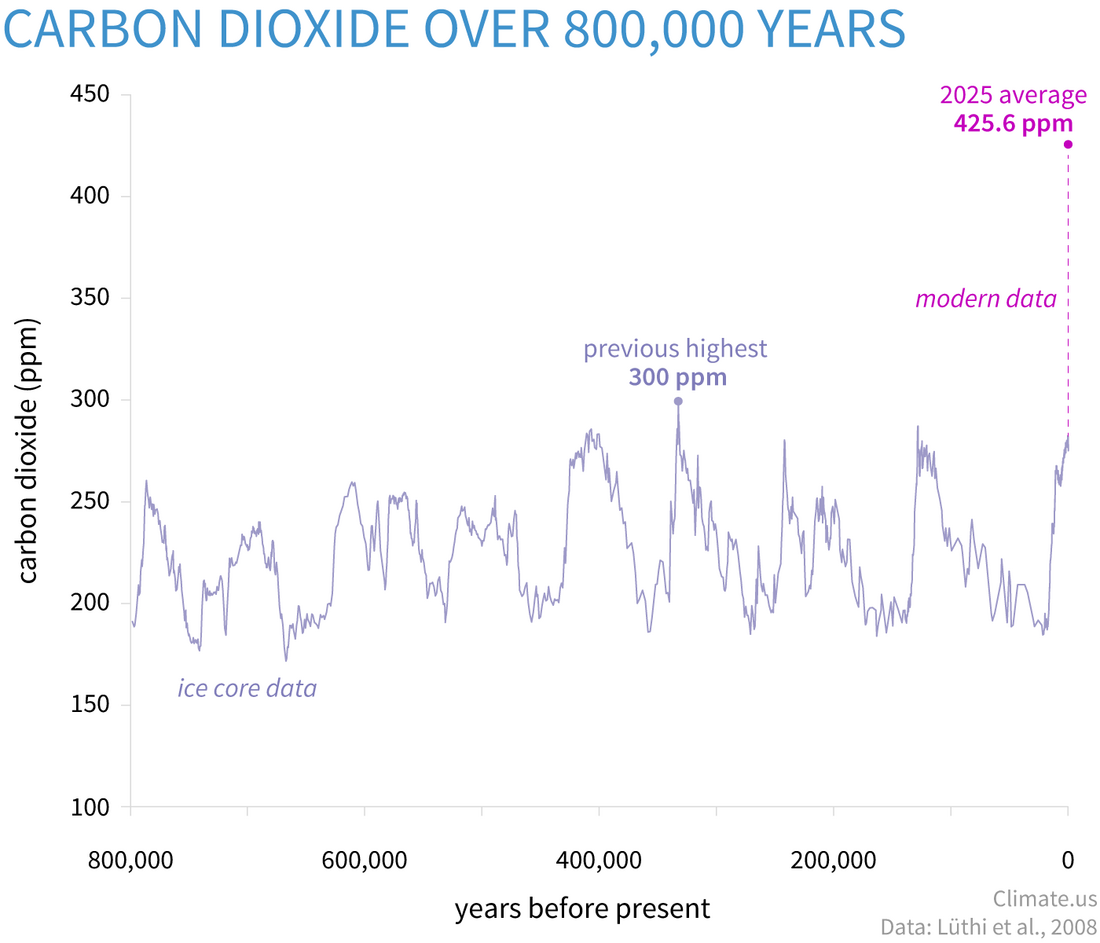
Atmospheric carbon dioxide (CO2) in parts per million (ppm) for the past 800,000 years based on ice-core data (light purple line) compared to 2025 concentrations (bright magenta dot). The peaks and valleys in the line show ice ages (low CO2) and warmer interglacials (higher CO2). Throughout that time, CO2 was never higher than 300 ppm (light purple dot, between 300,000 and 400,000 years ago). The increase over the last 60 years is 100 times faster than previous natural increases. In fact, on the geologic time scale, the increase from the end of the last ice age to the present value of 425.6 ppm (dashed magenta line) looks virtually instantaneous. Graph by Climate.us based on data from Lüthi, et al., 2008, via NOAA NCEI Paleoclimatology Program.
- Record and near-record temperatures were notable across the globe. The global mean temperature across land and ocean was among the three highest years on record, with records dating back as far as the mid-1800s. Near-neutral and La Niña-like conditions occurred in the eastern Pacific Ocean throughout the year, making 2025 the warmest year on record in which no El Niño conditions were present. Europe reported its warmest year on record, and Russia, China, the Republic of Korea, and Argentina each reported their second warmest. All five major global temperature datasets used for analysis in the report agree that the last 11 years (2015–25) were the 11 warmest on record.
- Despite cool ENSO and weak La Niña conditions, sea surface temperatures were at near-record-high levels. Cool ENSO (El Niño-Southern Oscillation) conditions were sandwiched between weak La Niña conditions during 2025. Despite the cooler conditions in the equatorial Pacific Ocean throughout much of 2025, the mean annual global sea surface temperature was the third highest in the 172-year record, and 0.38°C above the 1991–2020 average. Approximately 87% of the ocean surface experienced at least one marine heatwave in 2025. Only 26% of the ocean surface experienced at least one marine cold spell.
- Ocean heat and global sea level were the highest on record. Over the past half-century, the oceans have stored almost 90% of the excess energy trapped in Earth’s system by greenhouse gases and other factors. The global ocean heat content, measured from the ocean’s surface to a depth of 2000 m, continued to increase, and reached new record highs in 2025.
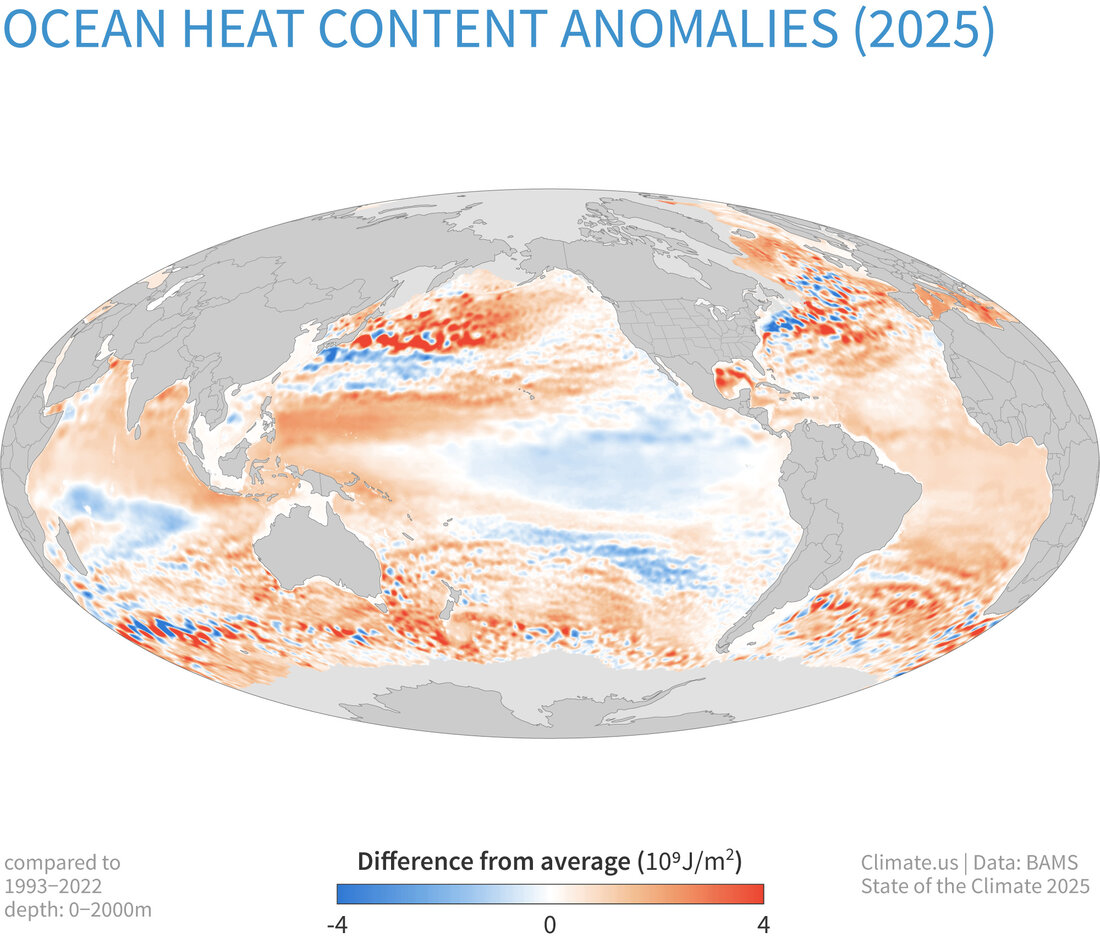
Global map of ocean heat content in the upper 2,000 meters (1.2 miles) of the ocean in 2025 compared to the 1993-2022 average. More places are warmer than average (orange) than cooler (blue). Adapted from Figure 3.5a in State of the Climate 2025 from the American Meteorological Society.
Global mean sea level was a record high for the 14th consecutive year, reaching about 111.2 mm above the average for 1993, when satellite altimetry measurements began. Warming oceans have contributed an average of 1.6±0.3 millimeters per year to rising sea levels since 2005, while melt from ice sheets and glaciers has contributed an average of 2.0±0.4 mm during that same period.
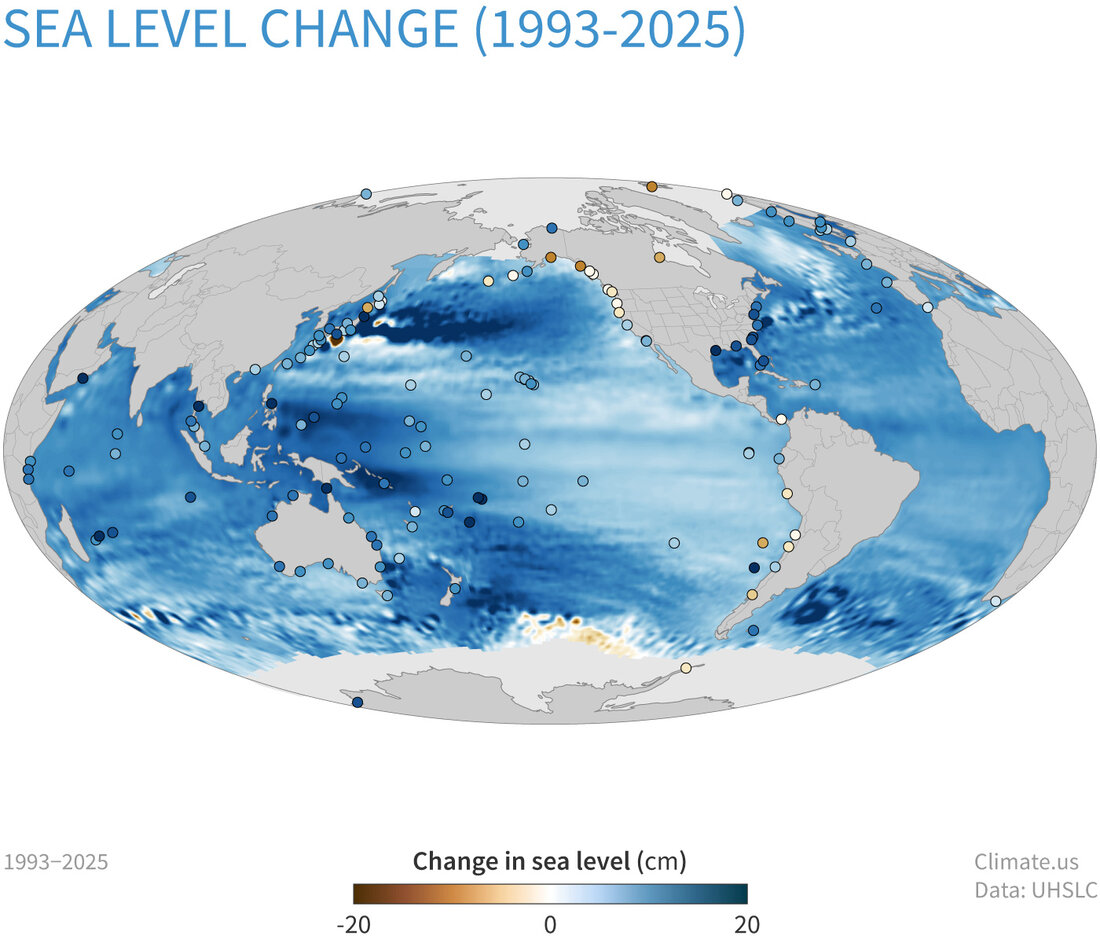
Between 1993 and 2025 mean sea level has risen across most of the world ocean (blue colors). In some ocean basins, sea level has risen 6-8 inches (15-20 centimeters). Rates of local sea level (dots) on the coast can be larger than the global average due to geological processes like ground settling or smaller than the global average due to processes like the centuries-long rebound of land masses from the loss of ice-age glaciers. Map by Climate.us based on data from University of Hawaii.
-
The Arctic saw near-record warmth. The Arctic had its second-warmest year in the 126-year record. Surface air temperatures in the Arctic are increasing at roughly three times the global average rate. Precipitation is also increasing across the region. In response to the precipitation and temperature increases, tundra plants have been increasing; 2025 marked the third highest value in the record with respect to greenness, a measure of the increase in plants and productivity.
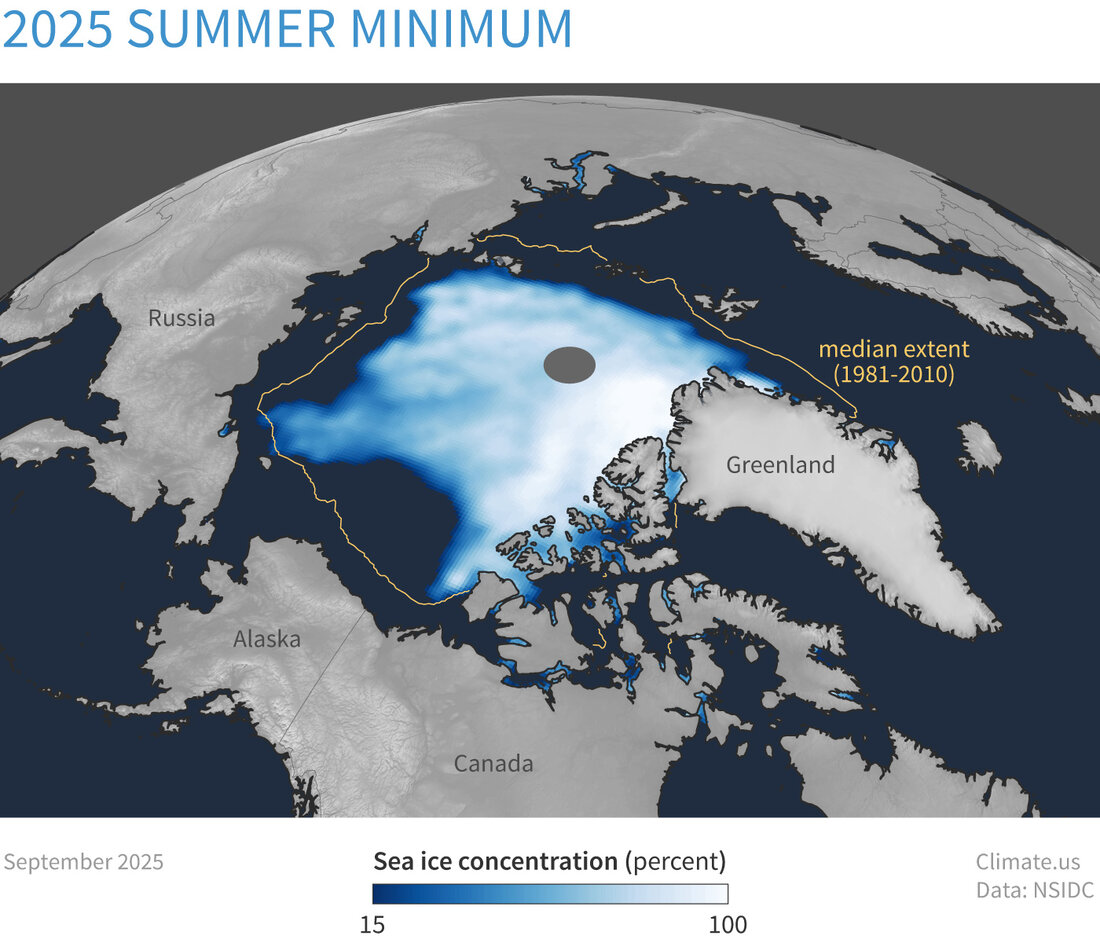
Sea ice concentration in September 2025, the month with the smallest ice extent of the year. Extent is the total area of ocean that's at least 15 percent ice covered. The gold line is the median extent for 1981-2010: half of years had smaller extents, half had larger. Map by Climate.us, based on data from the National Snow and Ice Data Center.
In Arctic waters, maximum sea ice extent in 2025 was the lowest in the 47-year record, while minimum extent was the 11th lowest. The thickness of the sea ice, which is related to its age, has also been decreasing over time. Ice older than four years old is nearly absent, with only 95,000 square kilometers of older ice in September 2025 as compared to 1.5 million square kilometers in the 1980s.
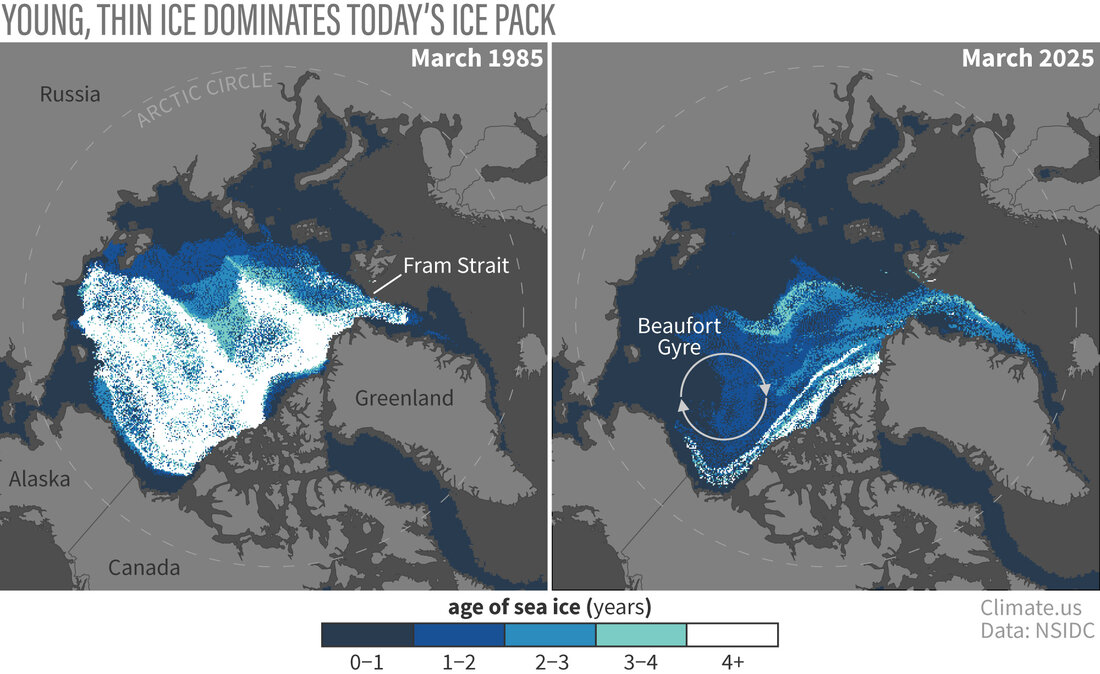
Routine observations of Arctic sea ice thickness only began a little over a decade ago. Experts use the age of the ice pack—which has been observed since the 1980s—as a proxy for ice thickness. In March 1985 (left), the winter maximum ice pack was dominated by ice at least 4 years old (white). In 2025 (right), only a small strip of very old ice remained tucked up against the islands of the Canadian Arctic. More than half of the winter ice pack was less than a year old (dark blue). Historically, the Beaufort Gyre served as a nursery for young, growing ice, but conditions have grown too warm for ice to persist there. Climate.us image, based on data from the National Snow and Ice Data Center.
- Antarctica saw record warmth and continued low sea ice. Antarctica observed its warmest year since the start of the record in 1979. Surface melt on the continent was above average on most ice shelves, and melt on the Antarctic Peninsula approached record levels in early January. Surrounding the continent, sea ice remained below average in 2025, following a nearly decade-long trend. Annual daily maxima and minima of sea ice extent were the third and fourth lowest on record, respectively.
-
Glaciers around the world continued to melt. Land-based glaciers continued to lose ice for the 38th consecutive year, losing the equivalent of more than 1 meter of water on average for the fourth straight year. About 41% of the loss experienced by glaciers since 1976 has occurred in the last decade.
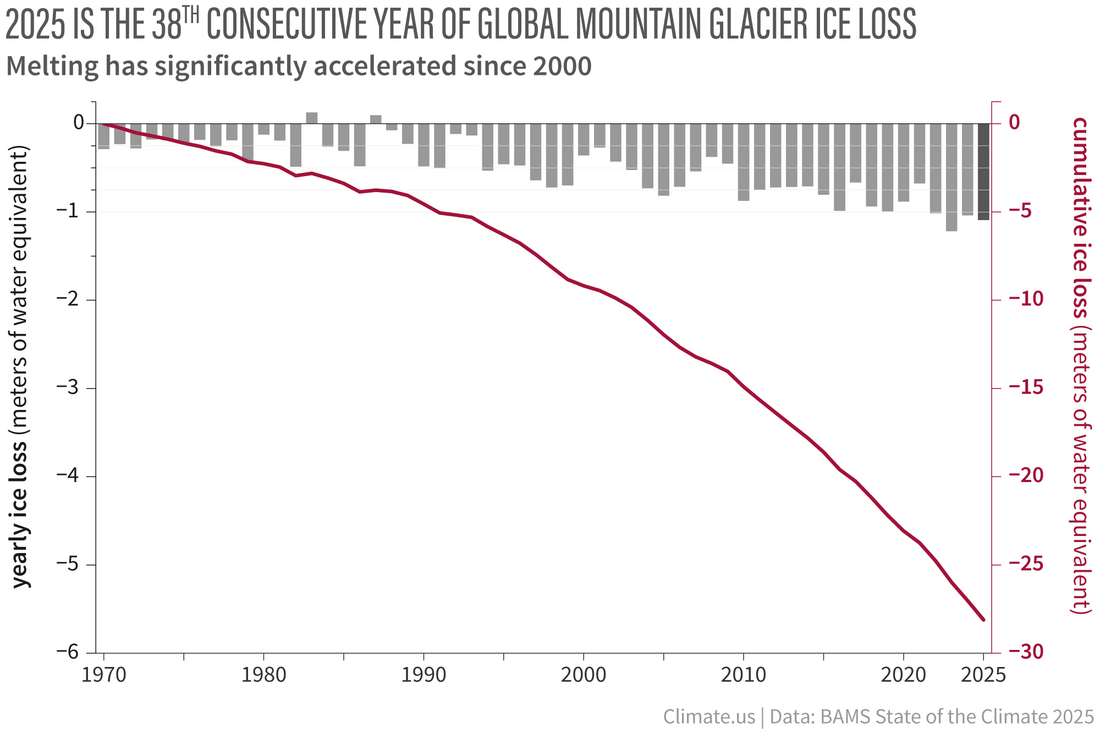
Yearly net gain or loss of ice mass in the World Glacier Monitoring Service "reference glacier" network since 1970 (gray bars, amount on left-hand vertical axis) combined with the running total ice loss through 2025 (red line, values on right-hand vertical axis.) Climate.us graph adapted from Figure 2.18 in State of the Climate in 2025.
- Tropical cyclone activity was above average. A total of 97 named tropical cyclones were observed during the Northern and Southern Hemispheres’ storm seasons, above the 1991–2020 average of 87. Five storms reached Category 5 intensity. Three of these storms occurred in the North Atlantic, tying for the second most on record for that basin. Hurricane Melissa became one of the strongest Atlantic hurricanes on record, with a maximum intensity of 190 miles per hour and a minimum central pressure of 892 hPa on October 28. Melissa made landfall in Jamaica as a Category 5 storm, causing devastation on the western part of the island. The storm caused 95 fatalities and resulted in at least $12.2 billion (U.S. dollars) in damage.
There were 12 named storms in the Australian basin during the 2024/25 season, which was the most in a season since 2005/06. In February, Tropical Cyclone Zelia reached Category 5 intensity at sea and made landfall as a Category 4 storm in Western Australia. Flood heights at the town of Marble Bar due to heavy rainbands were nearly 2 meters above previous records.
The State of the Climate report is a peer-reviewed series published annually as a special supplement to the Bulletin of the American Meteorological Society. The journal makes the full report openly available online.
About the American Meteorological Society
The American Meteorological Society (www.ametsoc.org) advances the atmospheric and related sciences, technologies, applications, and services for the benefit of society. Founded in 1919, AMS has a membership of more than 11,000 professionals, students, and weather enthusiasts. AMS publishes 12 scientific journals in the atmospheric and related oceanic and hydrologic sciences; sponsors more than 12 conferences annually; and offers numerous programs and services to the weather, water, and climate community.