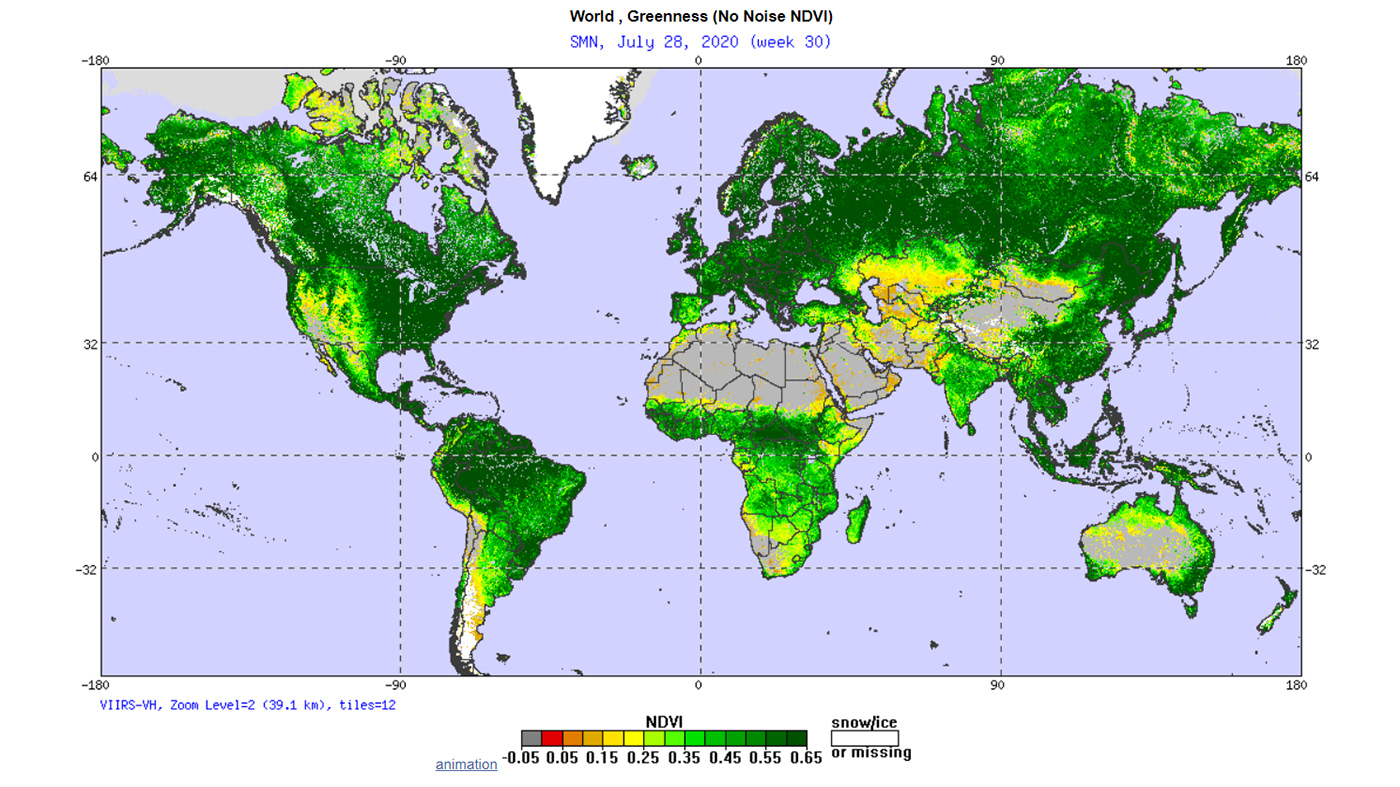
Maps of vegetation health products that allow us to monitor the status of vegetation around the world from space.
Maps of vegetation health products that allow us to monitor the status of vegetation around the world from space.
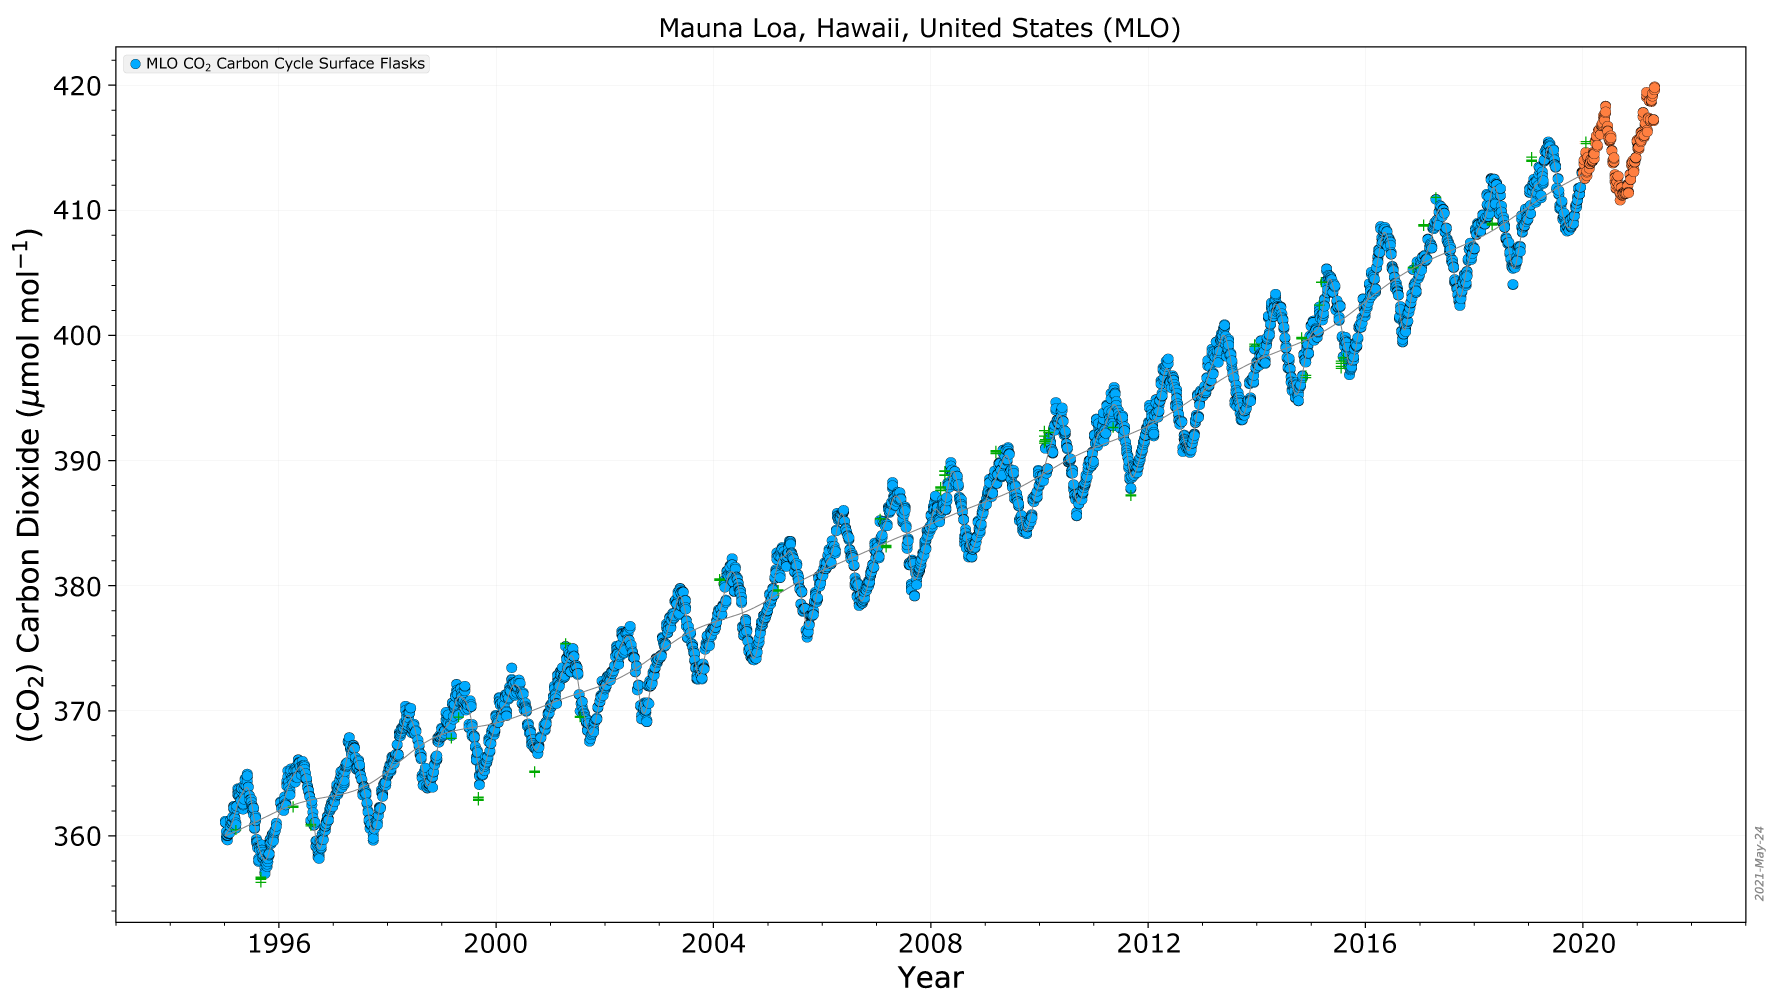
The Interactive Data Visualization tool gives users a way to explore the abundance of different gases at more than 200 sampling sites around the world.
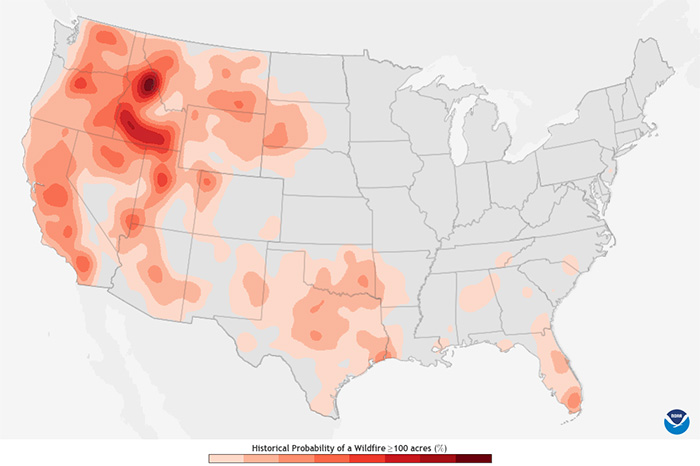
Shading on each map reflects how often fires with an area of 100 acres or larger were reported within 25 miles during a 24-year base period. The darker the shading, the higher the number of fires…
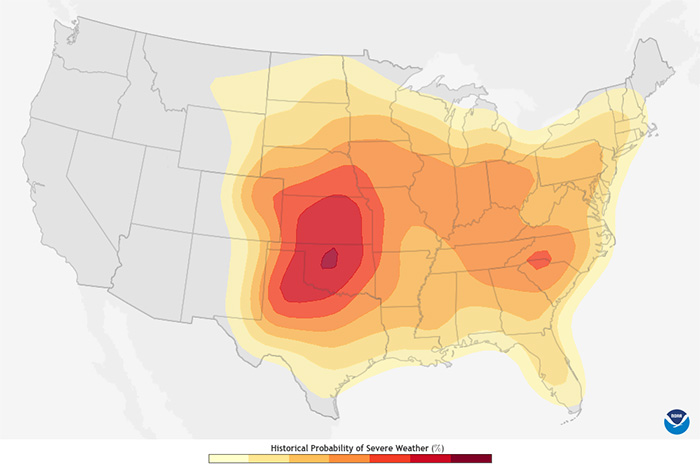
Shading on each map reflects how often severe weather occurred within 25 miles during a 30-year base period. The darker the shading, the higher the number of severe weather reports near that date…
Data from the IBTrACS database for more than 6,000 global tropical cyclones allows users to interactively study past hurricanes, looking at position, wind speed, and pressure.
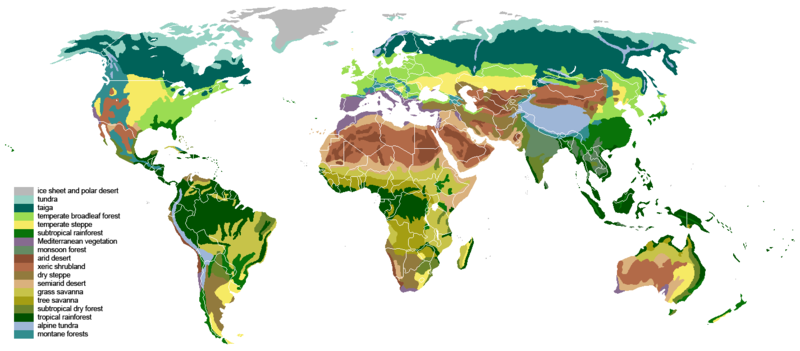
Climate classifications help people know what types of conditions a region usually experiences through the year. Rather than having to describe the full range of conditions observed in a region over each month or season of a year, a classification scheme can communicate expected conditions using just two or three terms.
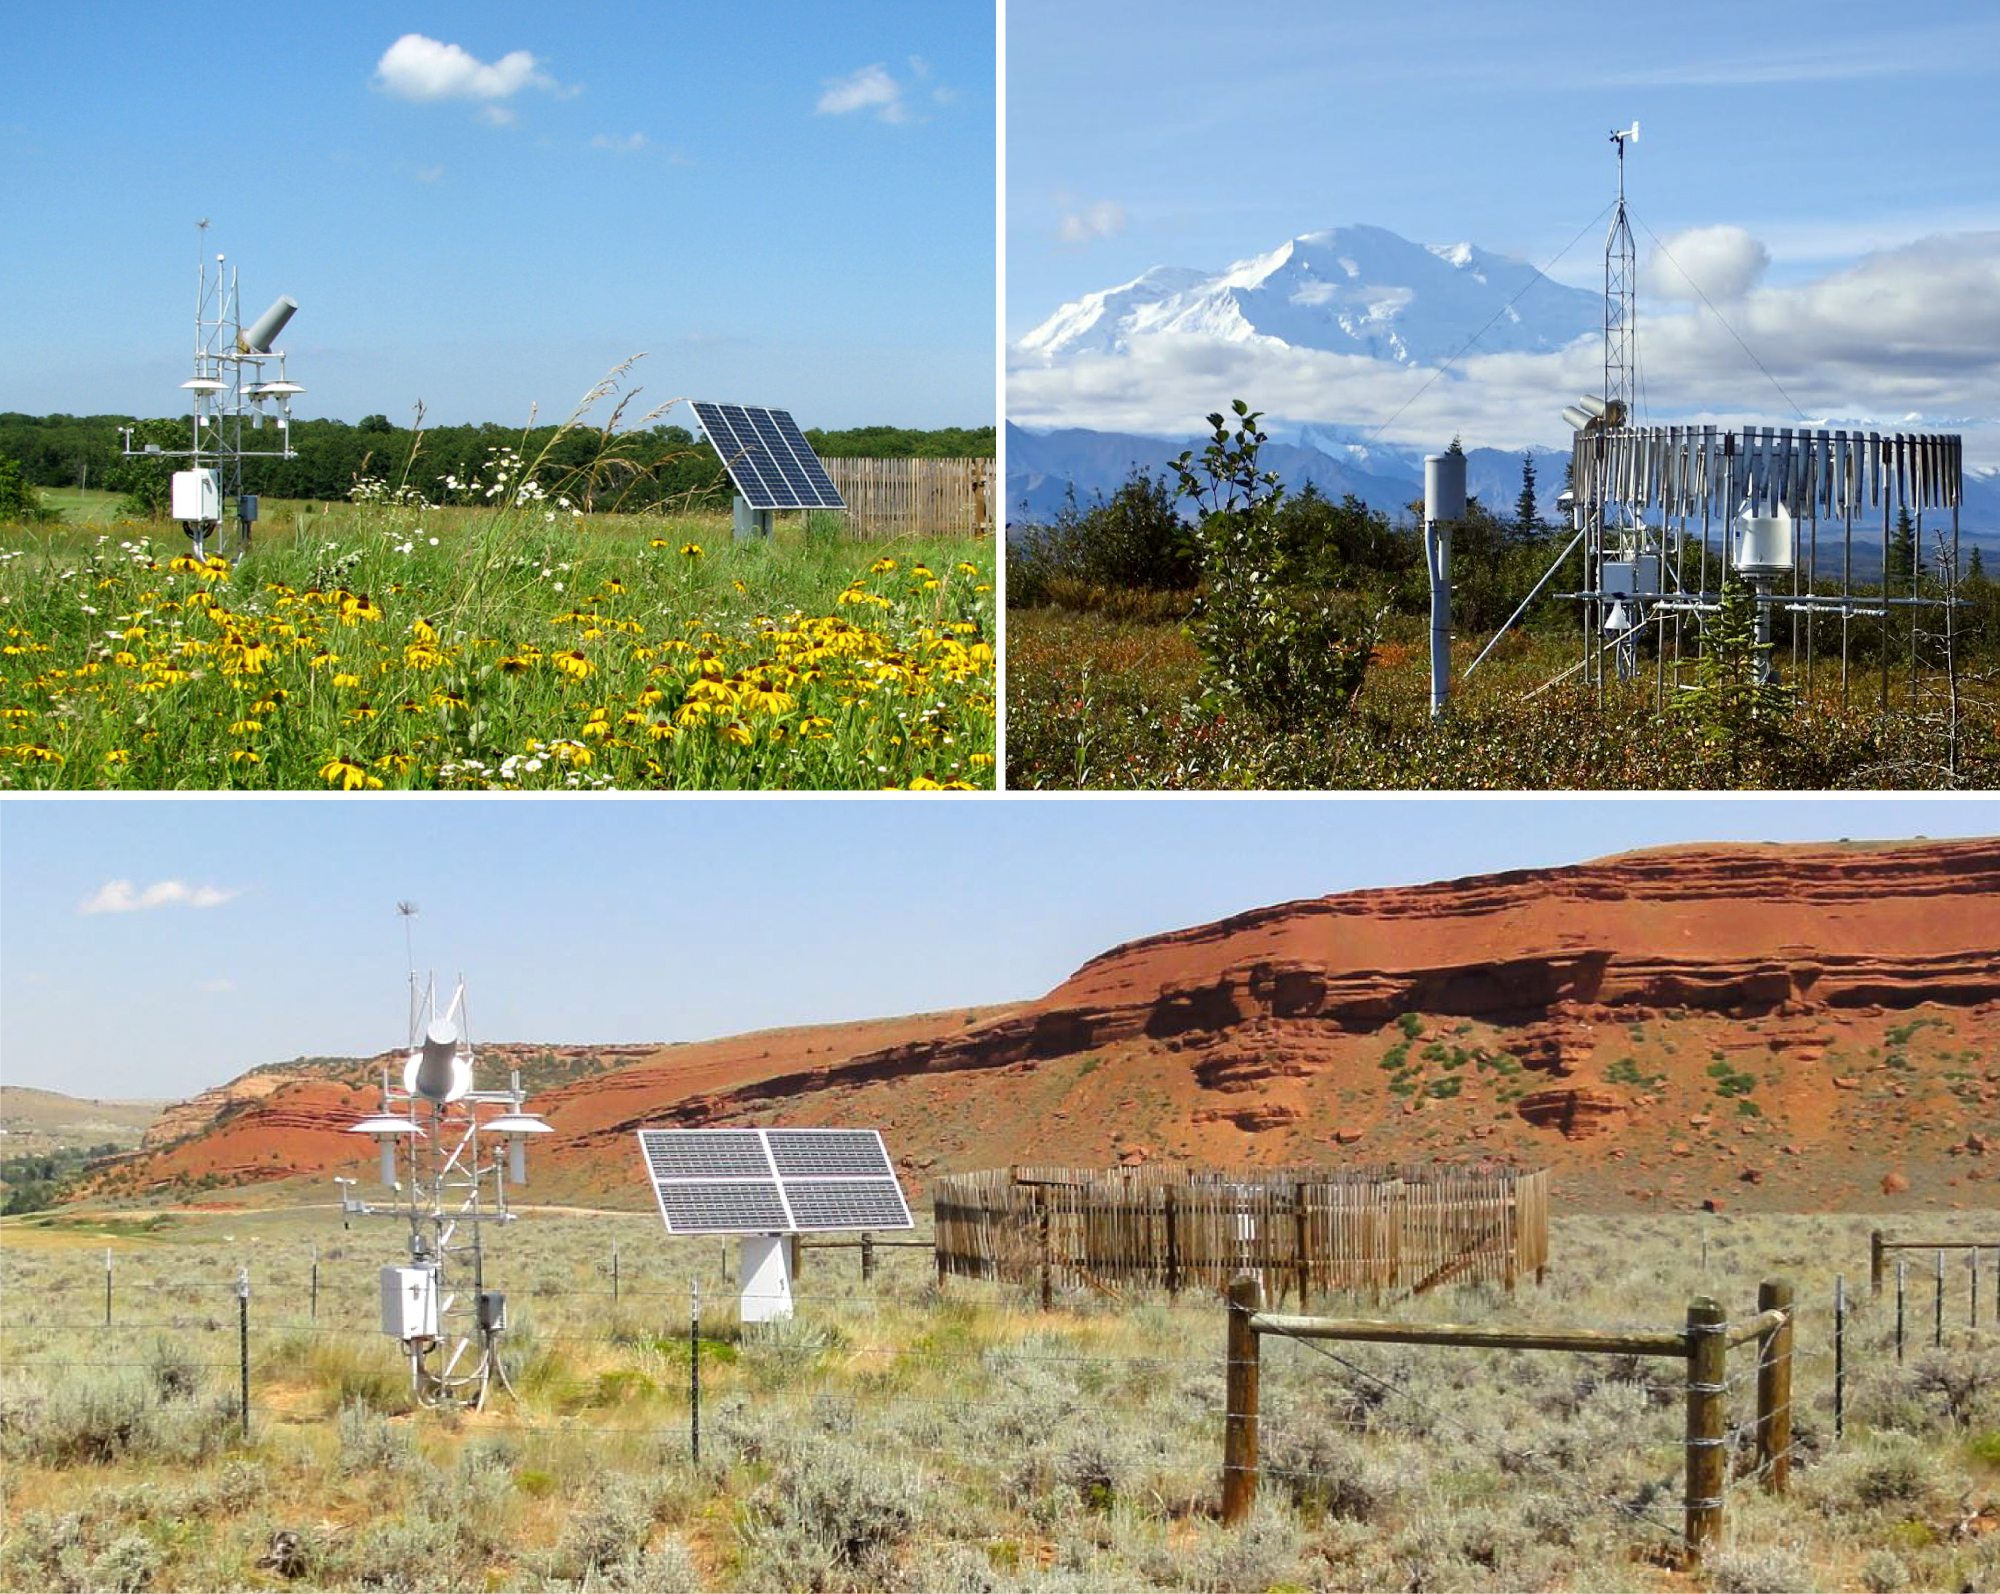
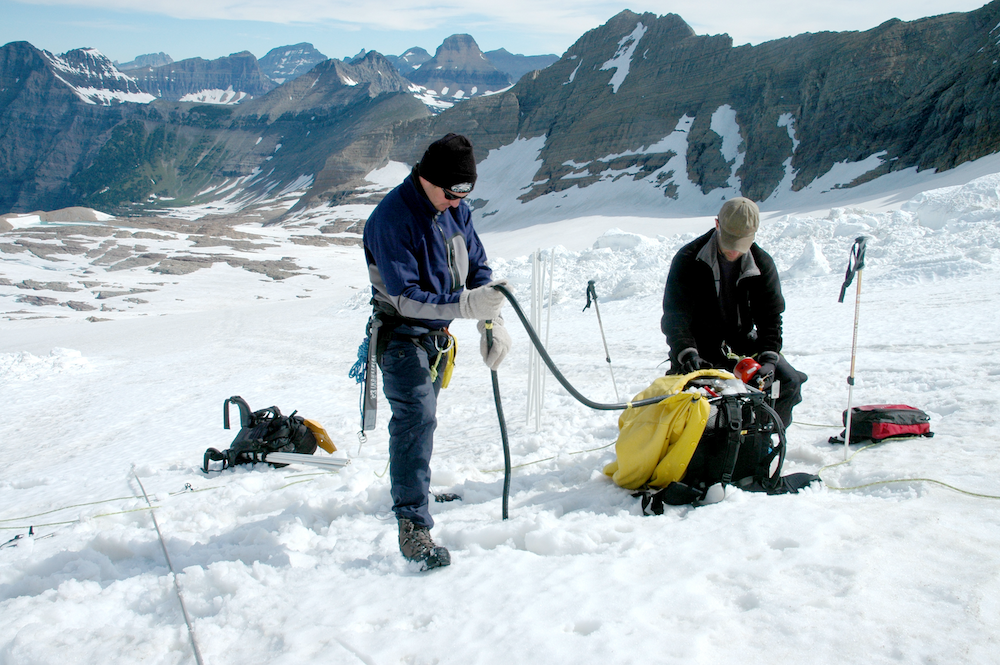
From daily temperature readings to tracking of hurricanes across the ocean, monitoring weather gives us a way to check the pulse of the planet. Combining local data from weather stations on the ground with remotely sensed data from instruments on satellites helps build a clear picture of the state of the atmosphere around the world.
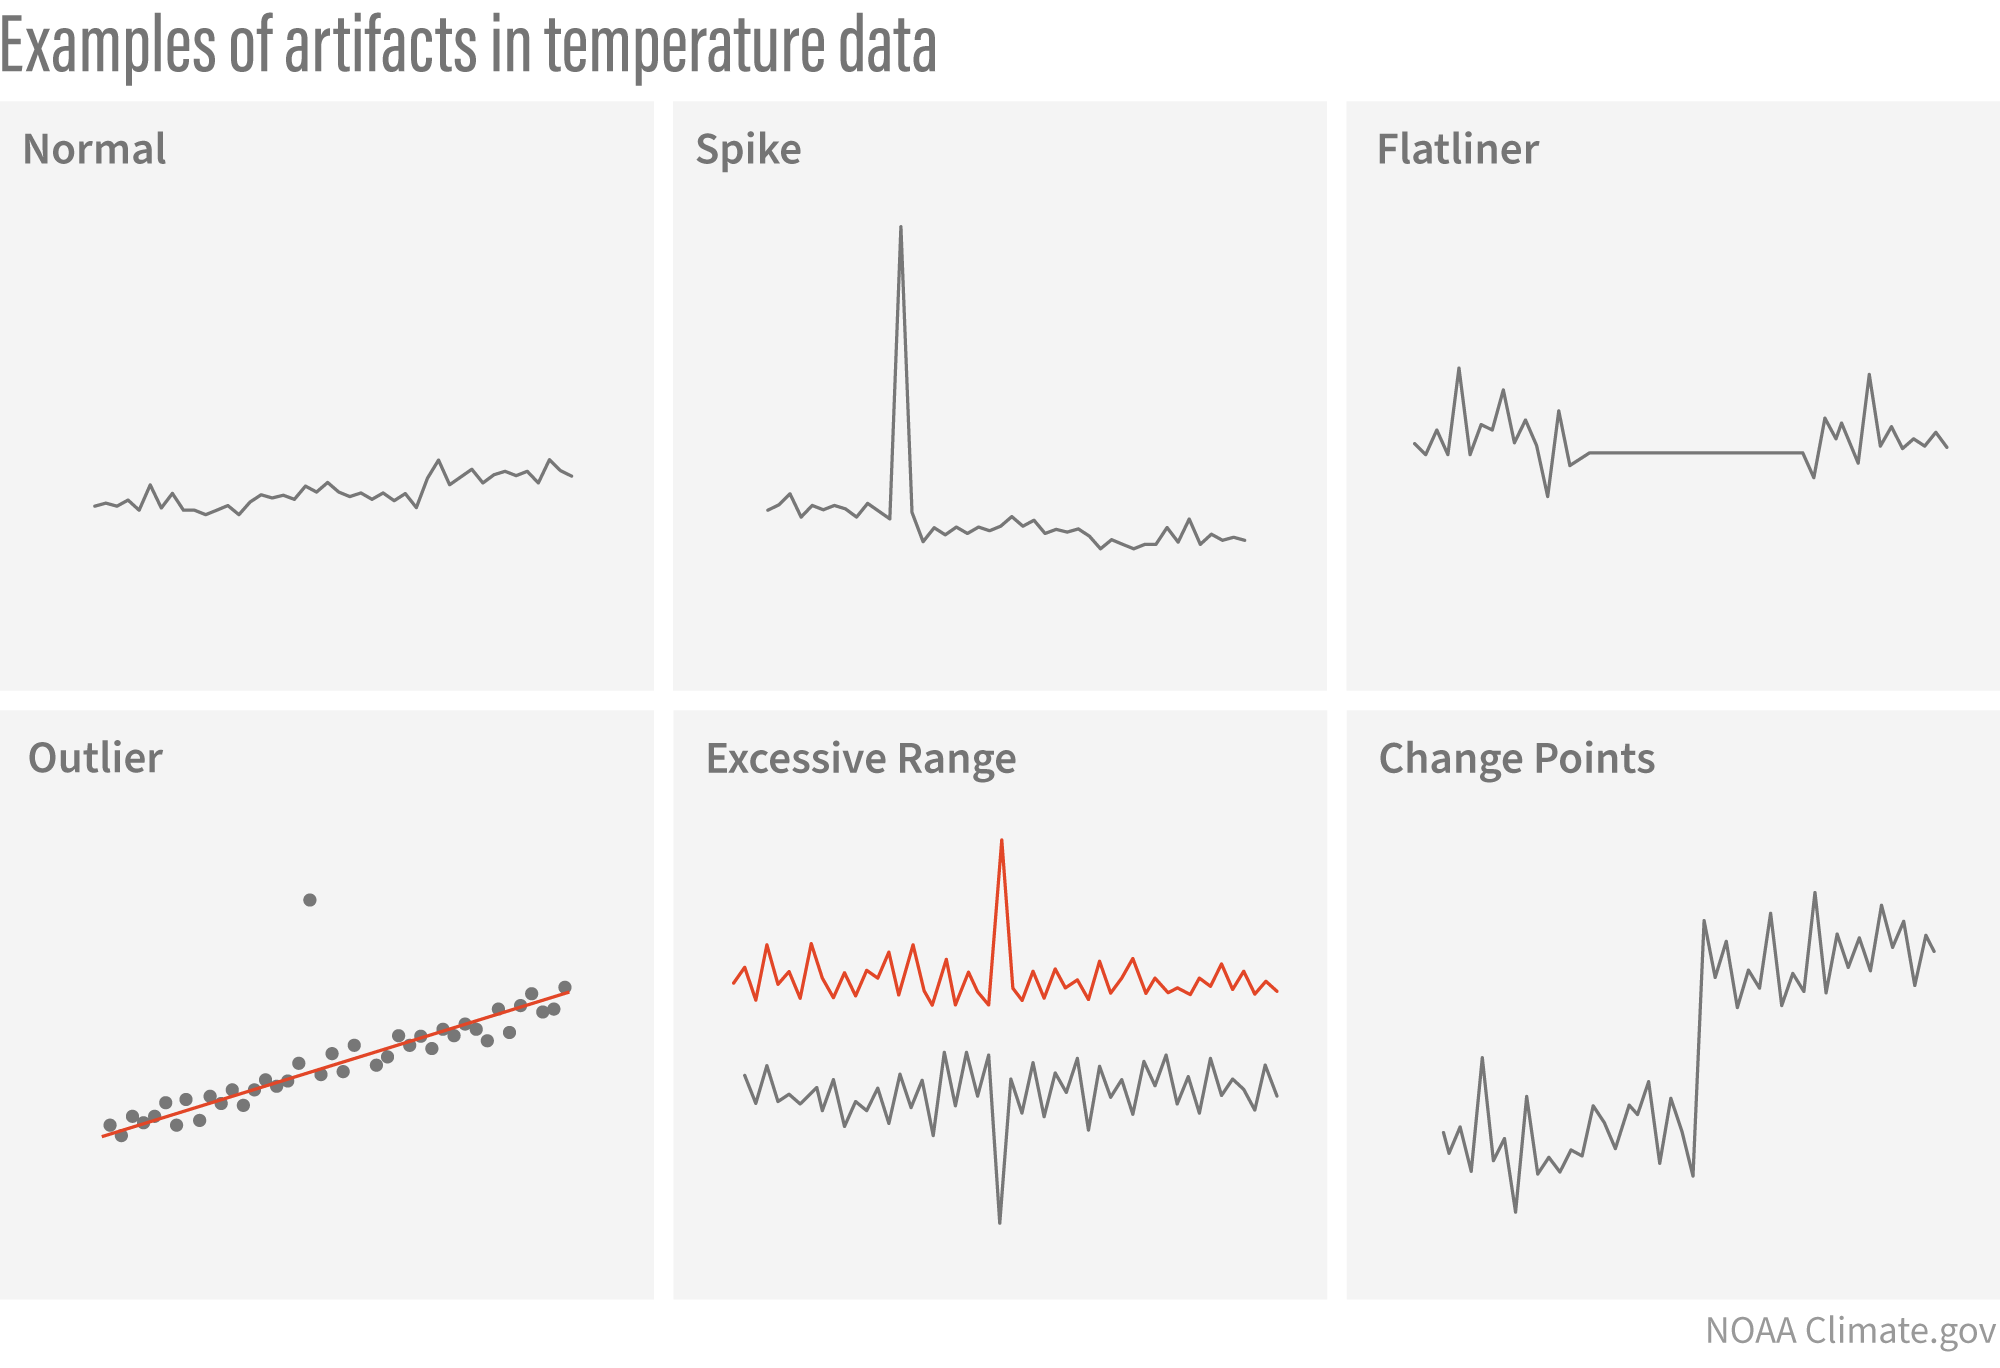
Learn more about how weather data, collected by volunteer observers and automated instruments, is processed into weather and climate data products such as maps, graphics, and models.
This page describes some of the 50 Essential Climate Variables identified by the Global Climate Observing System (GCOS) for worldwide monitoring.
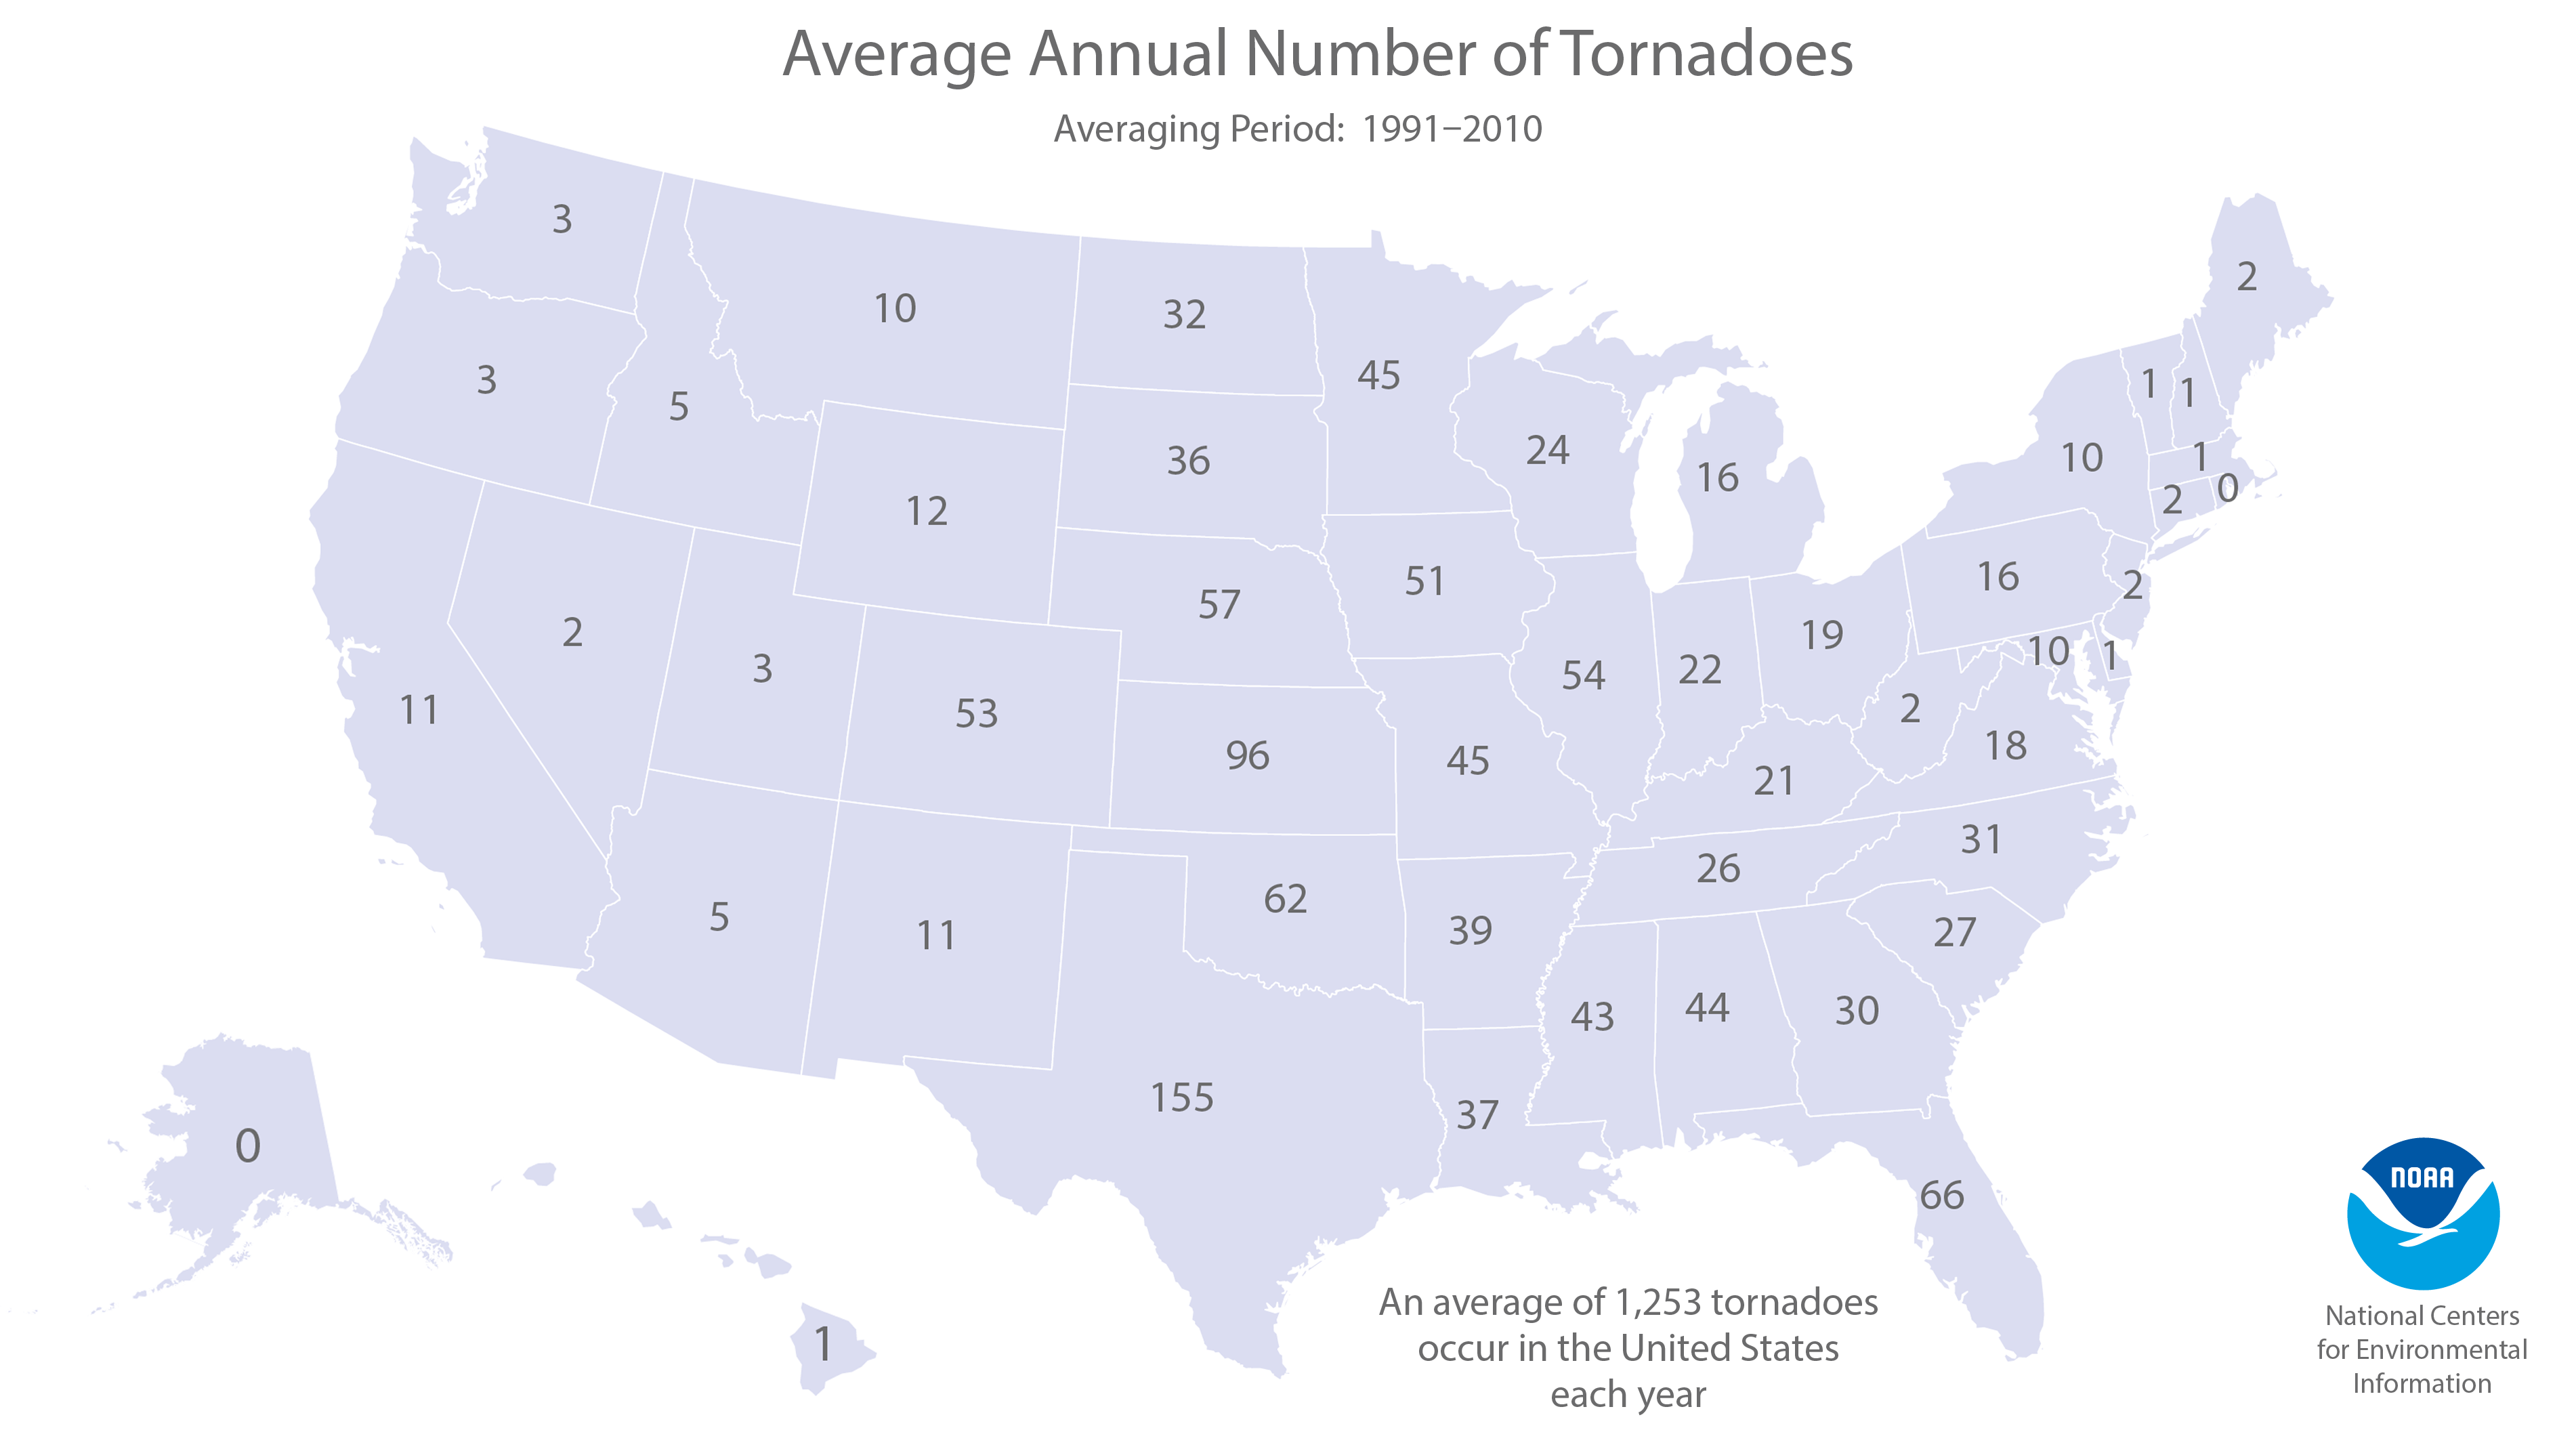
Graphs and maps show the number and locations of tornadoes reported each month since 1950.