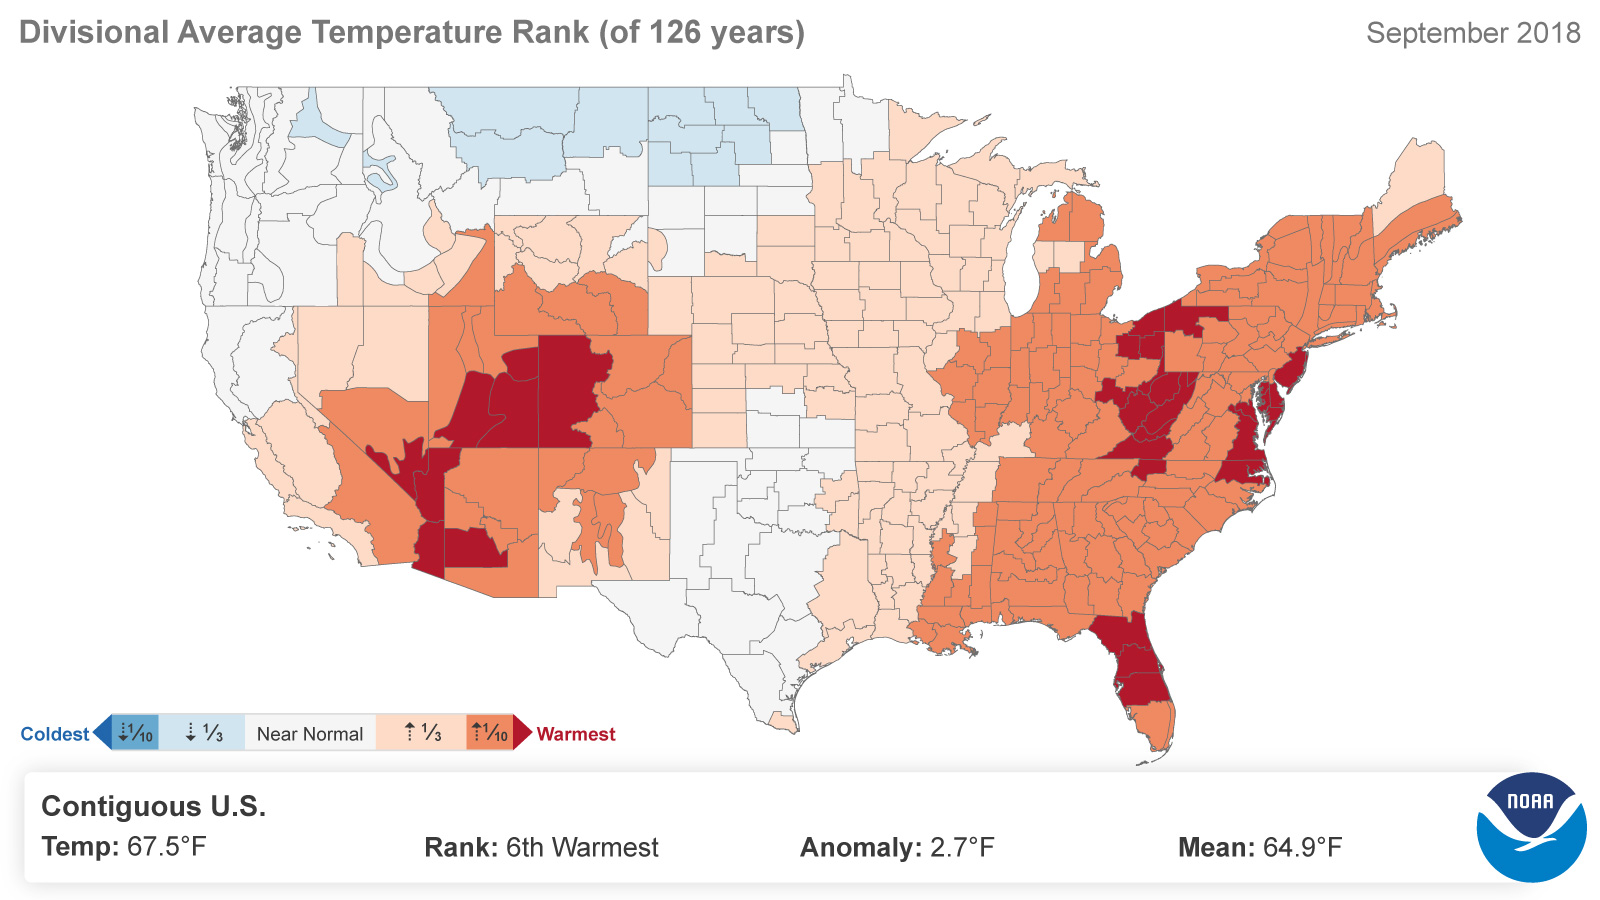
Generate maps showing data for each of the 344 climate divisions in the U.S. Climate Divisional Database.
Generate maps showing data for each of the 344 climate divisions in the U.S. Climate Divisional Database.
Access to paleoclimate records extending back thousands or millions of years, including descriptive information and explanatory notes, maps, searches, visualizations, and more.
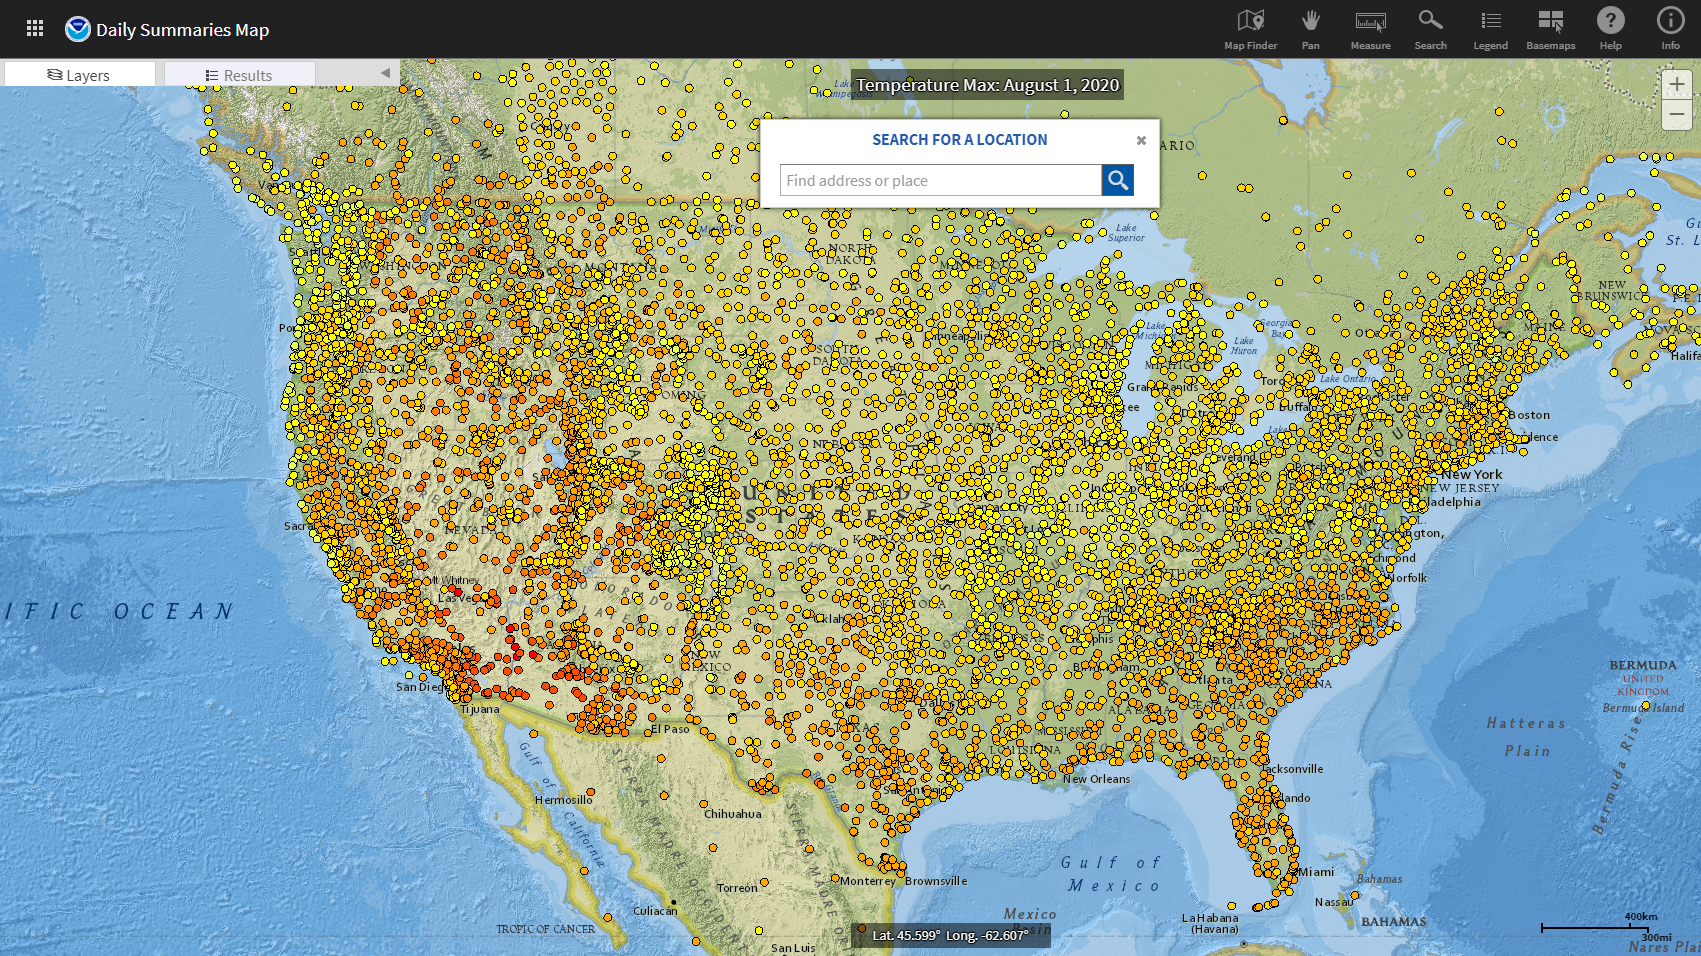
NCEI's Map Viewer Application presents a map interface to help users find, preview, and download or order climate and weather data.
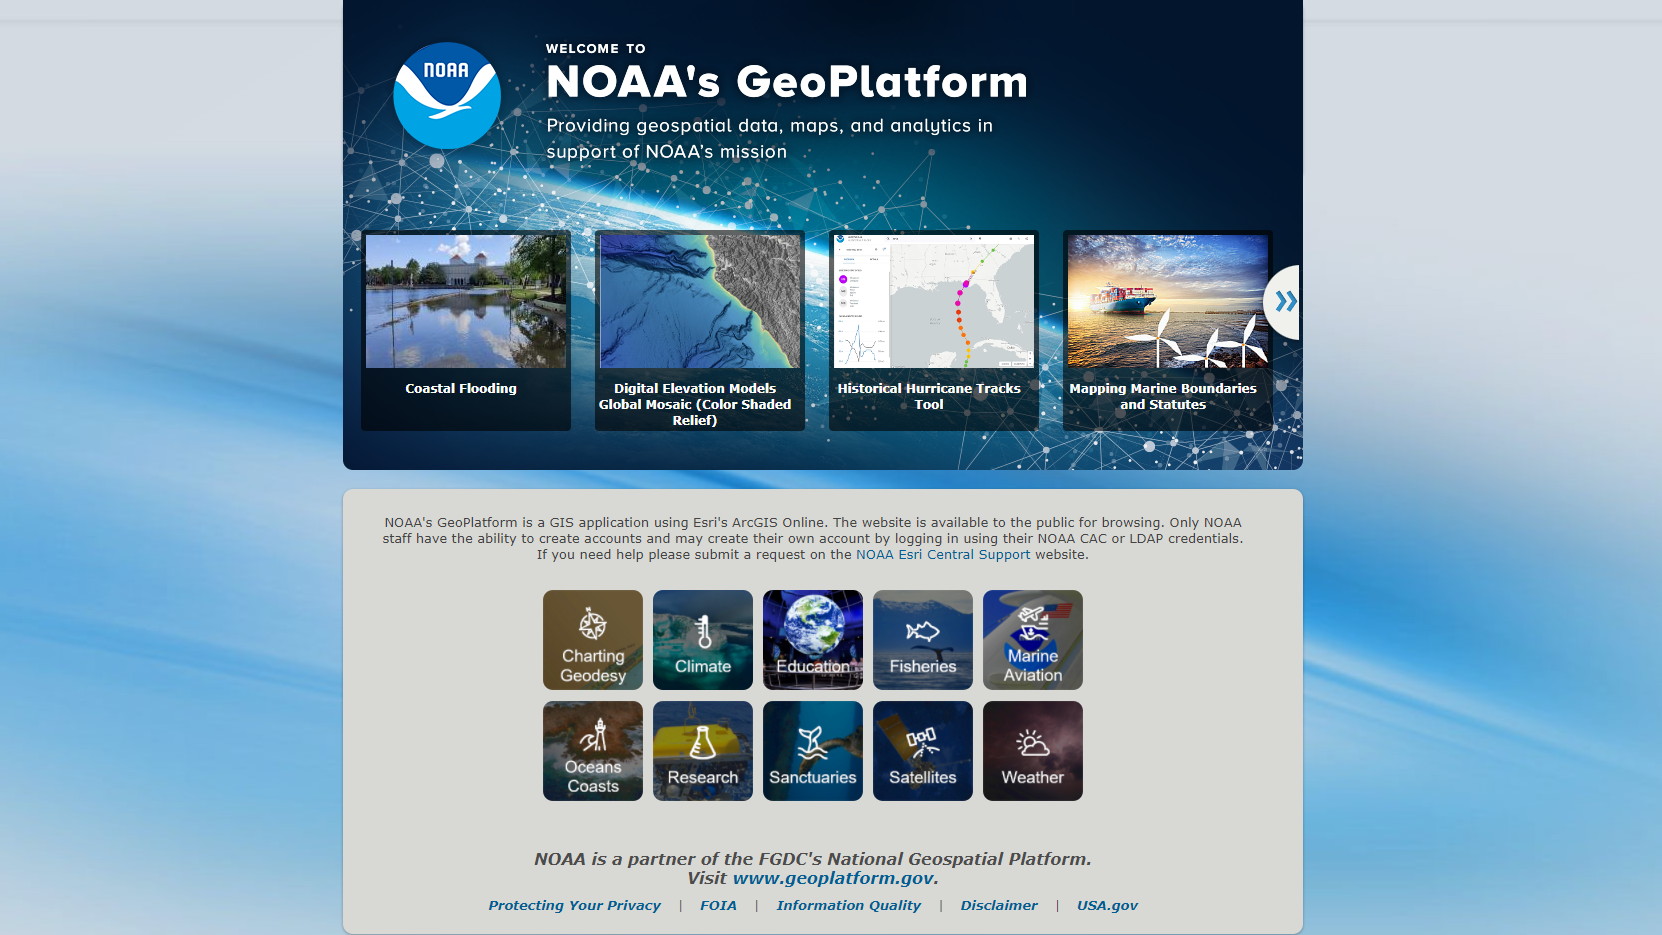
NOAA's Geoplatform provides geospatial data, maps, and analytics in support of NOAA's mission through a GIS application using Esri's ArcGIS Online. Maps, Layers, Scenes, Apps, and StoryMaps are available to the public for browsing.

A digital archive of oral history interviews related to our changing environment, climate, oceans, and coasts. The entire database houses nearly 2300 unique oral histories as part of 118 distinct collections.
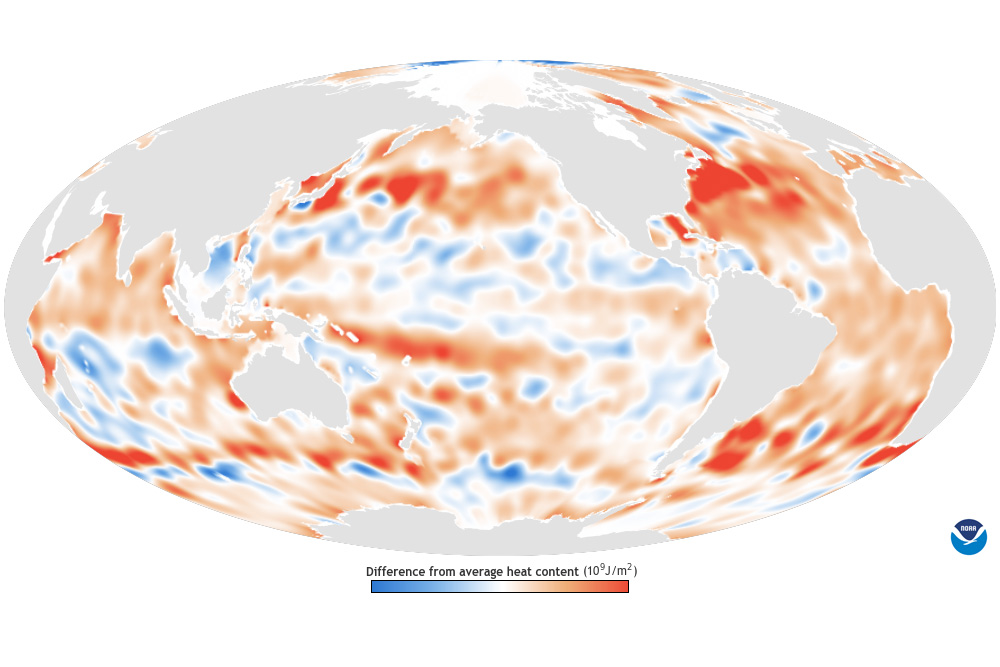
Colors on the map show where instruments detected more or less heat energy in the top 2,300 feet of water than the long-term average annual heat content. Orange areas show where heat content was…
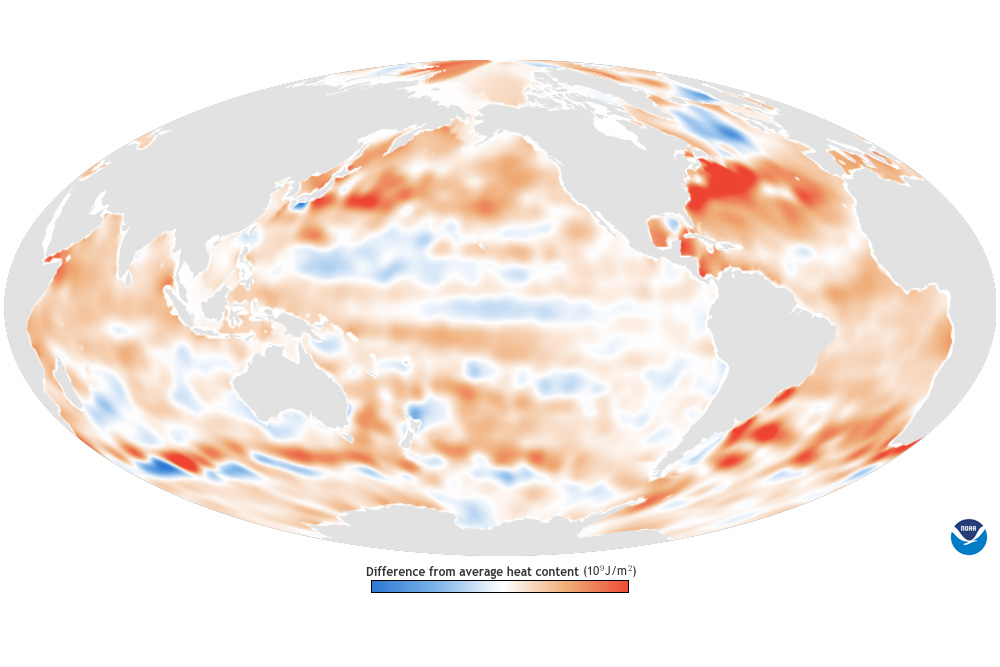
Colors on the map show where instruments detected more or less heat energy in the top 2,300 feet of water than the long-term average annual heat content. Orange areas show where heat content was…

This page describes some of the 50 Essential Climate Variables identified by the Global Climate Observing System (GCOS) for worldwide monitoring.
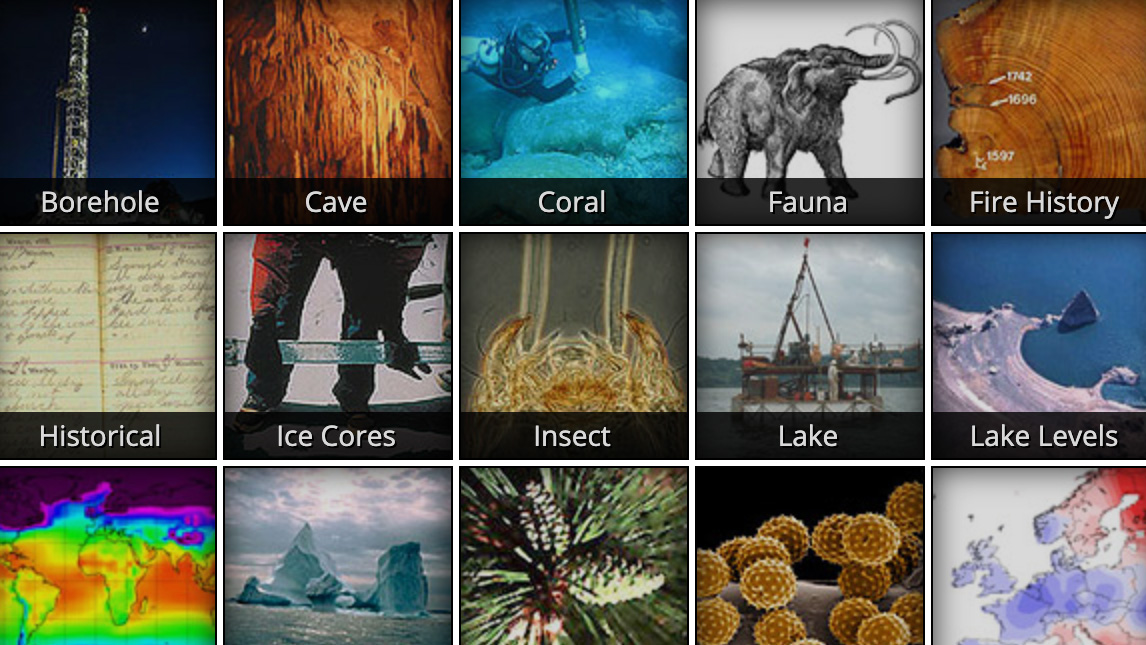
Some natural processes record the passage of time: for instance, layers of sediments accumulate over many years, and some of them preserve information about weather conditions during the time they were deposited. Throughout Earth's history, global and regional climate has changed on very long time scales, and many of the past conditions can be discovered by studying natural records.
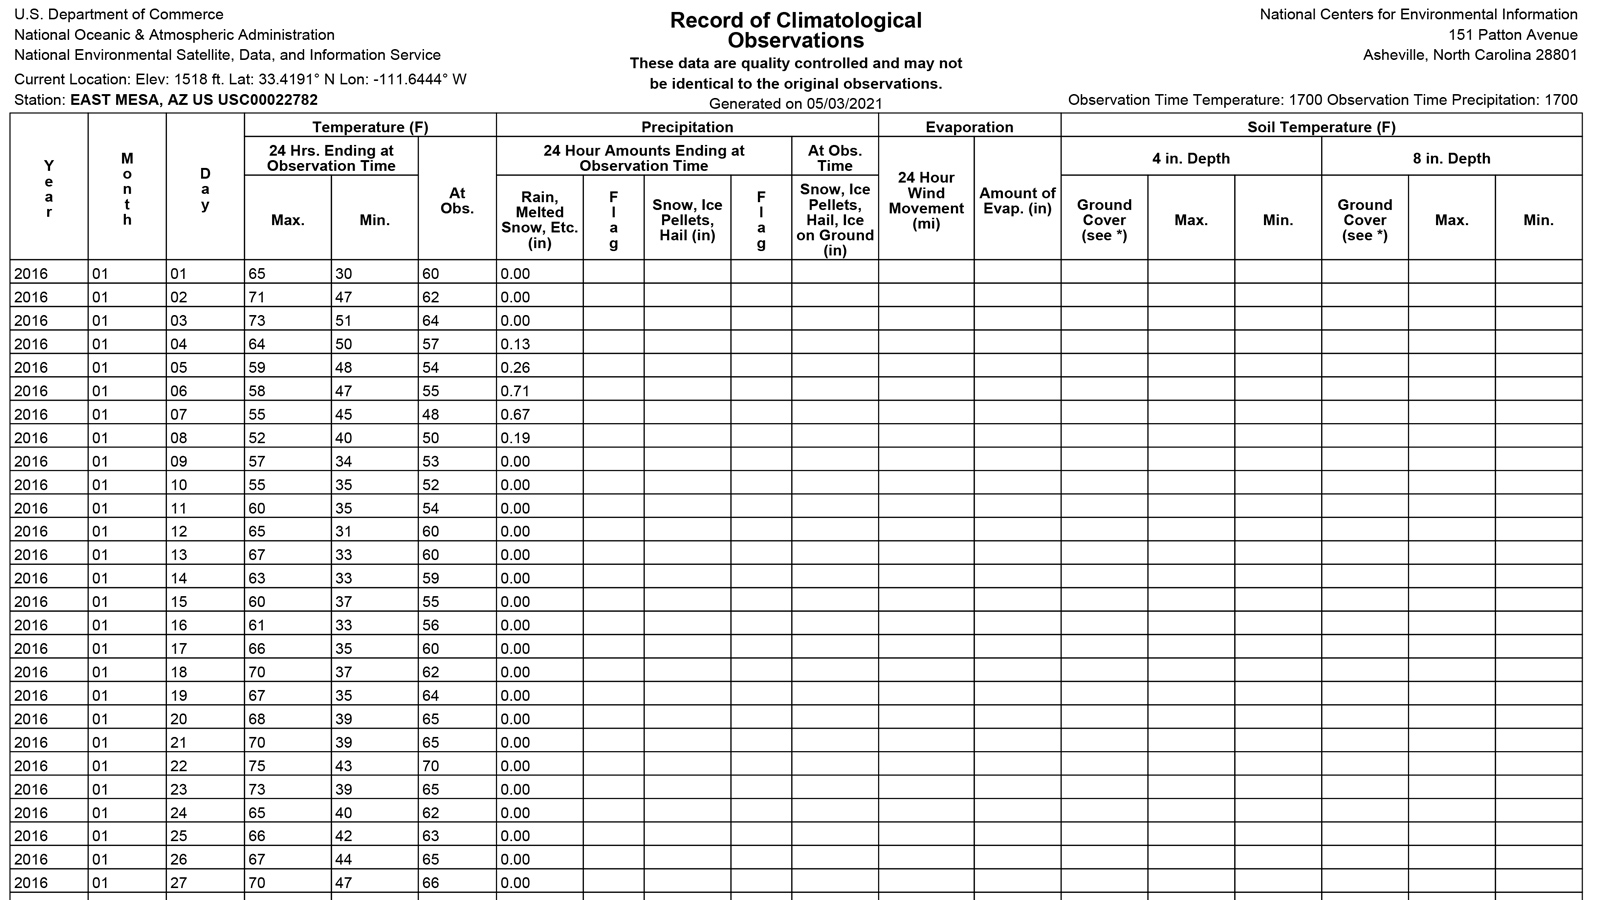
How much rain fell over the weekend? What was the temperature over the last few weeks? Tables of daily weather observations can answer these common questions.