Blogs
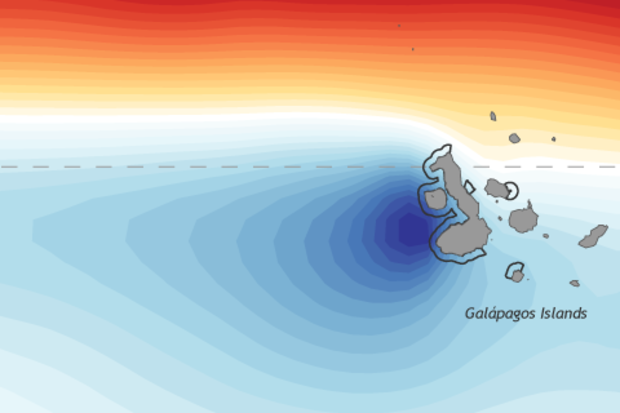
This is a guest post by Prof. Kris Karnauskas of the University of Colorado Boulder. He runs the Oceans and Climate Lab (@OceansClimateCU), which aims to improve the understanding the tropical ocean and atmosphere, its interaction with ecosystems, and how it has changed in the past and will change in the future. In his spare time we hear he runs ultra-marathons, which is simultaneously very cool and kind of crazy.
What happens when a tiny island rises from the seafloor and stands directly in the path of one of the grandest ocean currents in the world? This happened millions of years ago, when the Galapagos Archipelago formed. We now have penguins in the tropics and such a remarkable biolo…
Read article
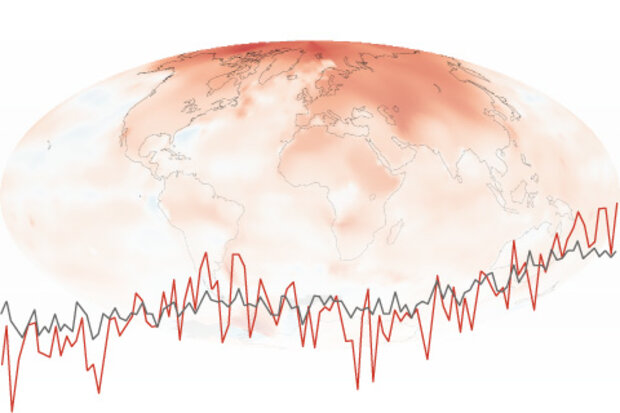
This week, Beyond the Data looks at one of the more well-grounded “rules of thumb” for understanding climate change. This one is pretty simple to put your thumb on: on average, cooler places and cooler times are warming more quickly than warmer places and times.
But first, let’s clarify–and emphasize–what we mean by a “rule of thumb.” Just like in its common usage, a rule of thumb here refers to something generally true often enough to be useful and informative, but not universally reliable–kind of a “two-out-of-three” or “three-out-of-four” kind of situation.
So, it's nothing to thumb your nose at, because it’s true more often than not. But it’s also not the case everywhere. &nb…
Read article
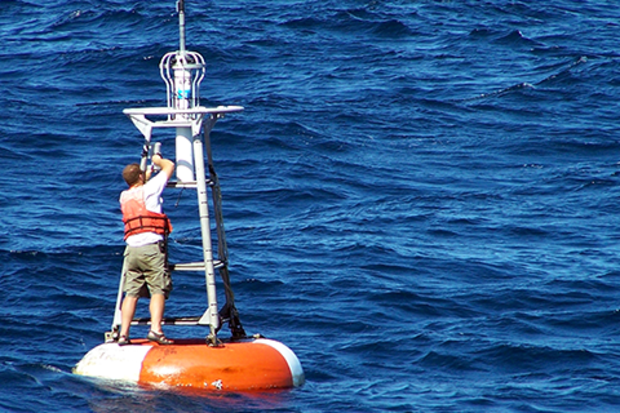
As Emily has painstakingly documented at the beginning of every month for what seems like an eternity, we have an El Niño event on our hands. And if you’ve read her posts religiously (which of course you have, because they are awesome), you already know that one way Emily shows the strength of El Niño is via the sea surface temperature (SST) anomalies in a region of the Pacific Ocean called the Niño3.4 region.
You may also have noticed that when we talk about how one event compares to another, we usually say something like, “Depending on what dataset you use….” Up until now, though we’ve haven’t talked much about how exactly we determine which sea surface temperature dataset to use to det…
Read article
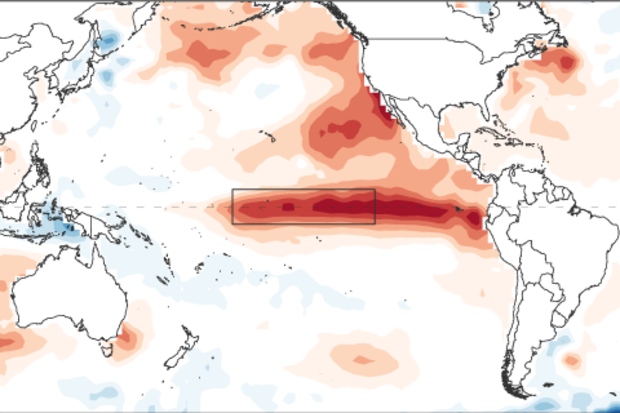
The peak of our current El Niño is expected to occur in the next month or so… but what does that mean? We measure El Niño events by how much warmer the surface waters in a specific region of the equatorial Pacific are, compared to their long-term average. The difference from average is known as the “anomaly,” and we use the average anomaly in the Niño3.4 region as our primary index for El Niño. When the index in this region is at its highest, we have our peak El Niño.
However, El Niño-related impacts have been occurring around the globe for months already, and will continue for several months after the warmest temperatures occur in the tropical Pacific Ocean. For example, du…
Read article
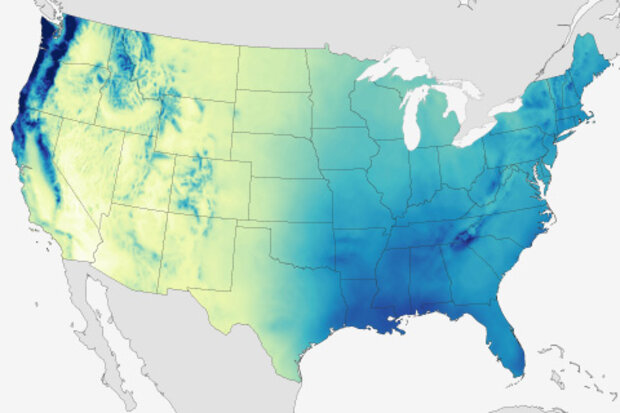
Many factors contribute to the climatology of a given location, including how close to the equator you are, proximity to the ocean, and elevation. But when it comes to what causes climate to vary over seemingly short distances, few things can compare to the influence of topography.
Take my city, for example. I live in Asheville, in western North Carolina, a small city in the heart of the Southern Appalachians. I can drive ten minutes and be in one of the driest locations east of the Mississippi, or drive an hour and be in one of the wettest. That the temperature and precipitation patterns that we experience here can be so different from somewhere just a few miles away is due not just to e…
Read article