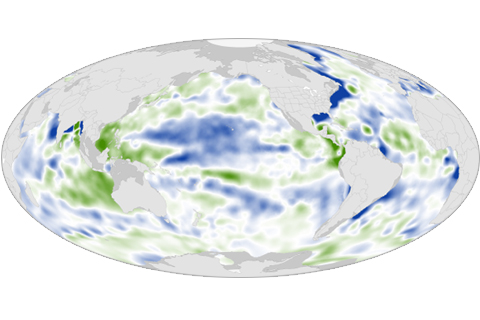
Large-scale patterns of sea surface salinity in 2013 mirrored the overall trend seen from 2004 to 2013: salty, dry areas are becoming increasingly salty, and fresher areas are becoming increasingly fresh.
Large-scale patterns of sea surface salinity in 2013 mirrored the overall trend seen from 2004 to 2013: salty, dry areas are becoming increasingly salty, and fresher areas are becoming increasingly fresh.
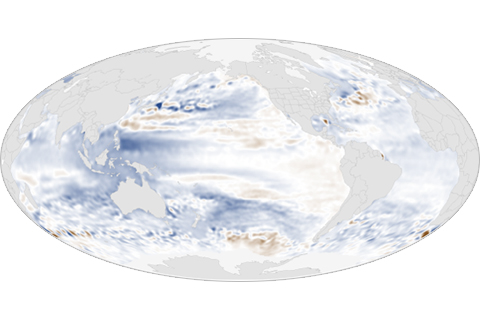
In 2013, global average sea level was 1.5 inches above the 1993-2010 average, which is the highest yearly average in the satellite record (1993-present). Overall, sea level continues to rise at a rate of one-eighth of an inch per year.
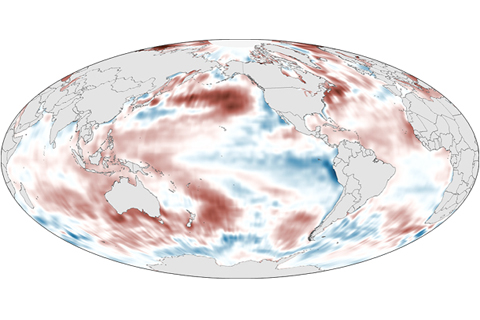
The globally averaged sea surface temperature in 2013 was among the 10 highest on record, with the North Pacific reaching an historic high temperature. ENSO-neutral conditions and a negative Pacific Decadal Oscillation pattern had the largest impacts on global sea surface temperature in 2013.
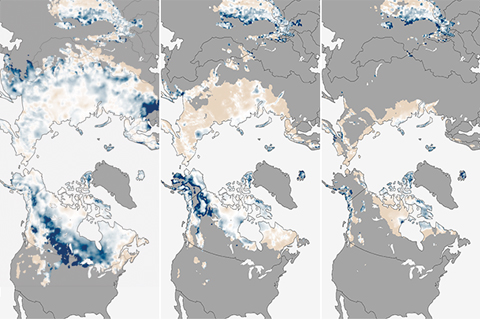
While the Northern Hemisphere’s snow cover on land ranked as the 13th most extensive on record in 2013, snow cover extent at the end of the cold season has dropped by 19.9 percent per decade since 1979 relative to the 1981-2010 average.
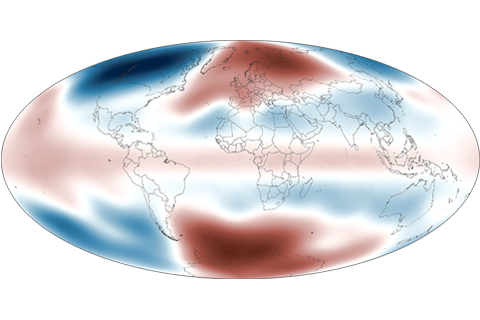
Observing temperature patterns in the lower stratosphere gives scientists clues about our planet's changing climate. Global average temperatures in the lower stratosphere for 2013 were slightly below the 1981–2010 average.
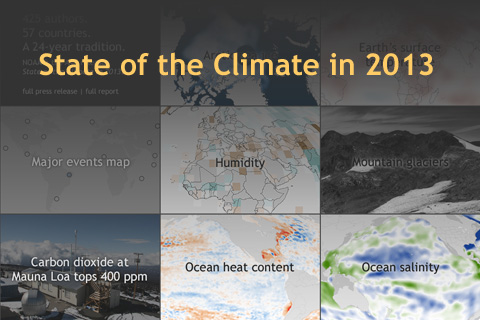
From the strongest typhoon ever observed to historically high atmospheric carbon dioxide levels, the State of the Climate in 2013 report provides a complete rundown on the state of Earth's climate and how it is changing.
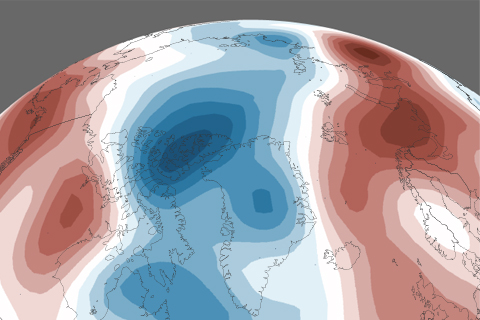
From reindeer to regional temperature patterns, from sea ice age to Greenland surface melt, the Arctic Report Card is a yearly assessment of the Arctic's physical and biological systems and how they are changing. This collection of visual highlights from the 2013 report is a story of the Arctic in pictures.
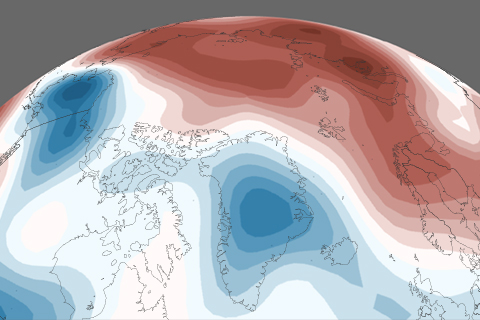
Since the mid-1960s, the Arctic has warmed about 3.6°F (2.0°C)—more than double the amount of warming in lower latitudes. In 2012 (the last complete calendar year available at the time scientists began working on the 2013 Arctic Report Card), the annual average temperature was the sixth warmest on record.
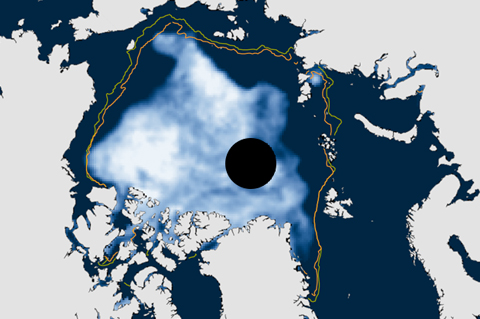
To be consistent with NOAA's use of 30-year periods for the official "climate normals," the National Snow and Ice Data Center switched its baseline period for sea ice analyses from 1979-2000 to 1981-2010. Compared to the new normal, the low ice conditions of the recent past will appear less abnormal than they used to.
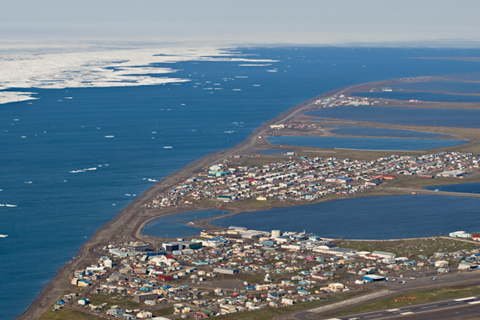
Since 2002, Octobers in Barrow, Alaska—America's northernmost town—are regularly near the warmest on record, thanks to the retreat of sea ice. The warming hinders traditional hunting activities, makes the town more vulnerable to storm surge flooding, and thaws the frozen ground to greater depths, which destabilizes roads, house foundations, and traditional underground freezers.