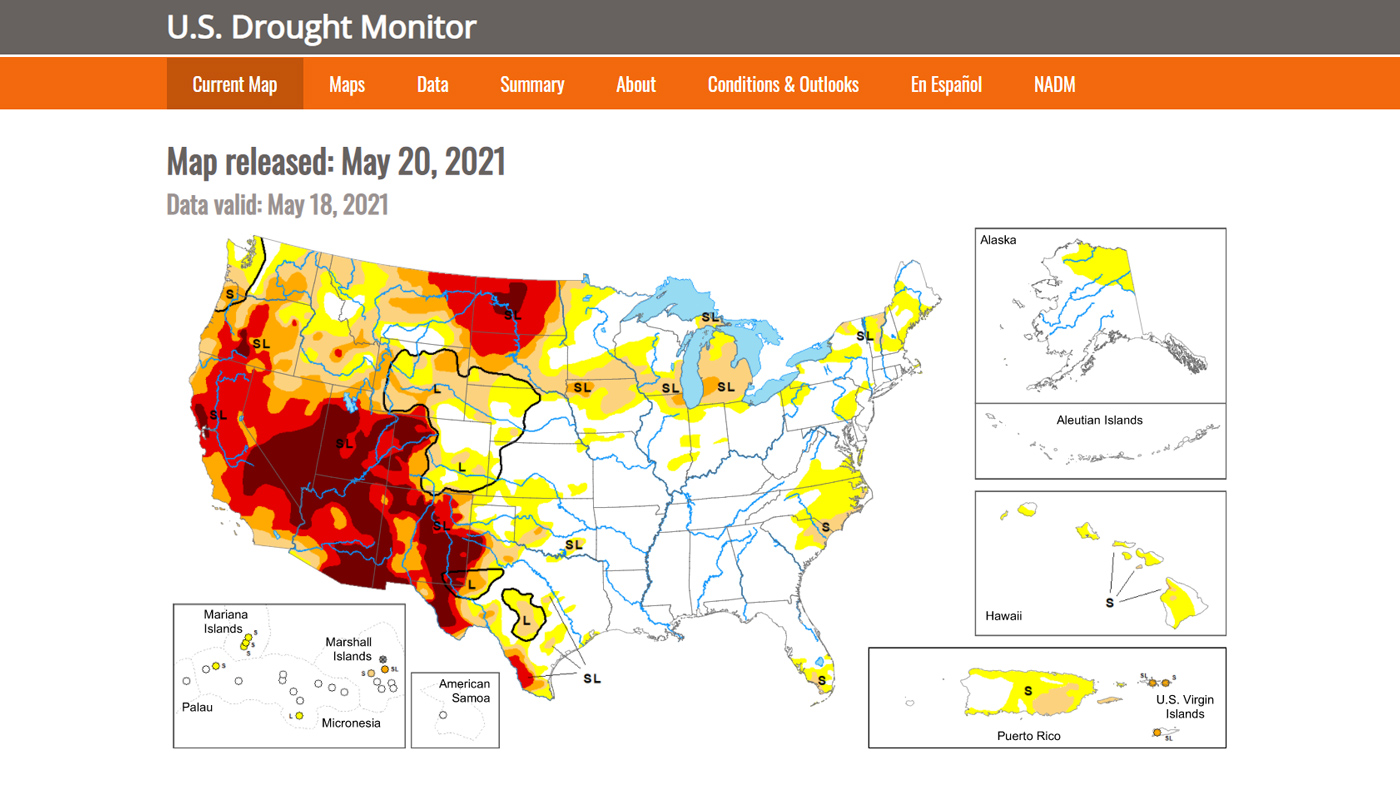
A weekly map—updated each Thursday—that shows the location and intensity of areas currently experiencing abnormal dryness or drought across the United States.
A weekly map—updated each Thursday—that shows the location and intensity of areas currently experiencing abnormal dryness or drought across the United States.
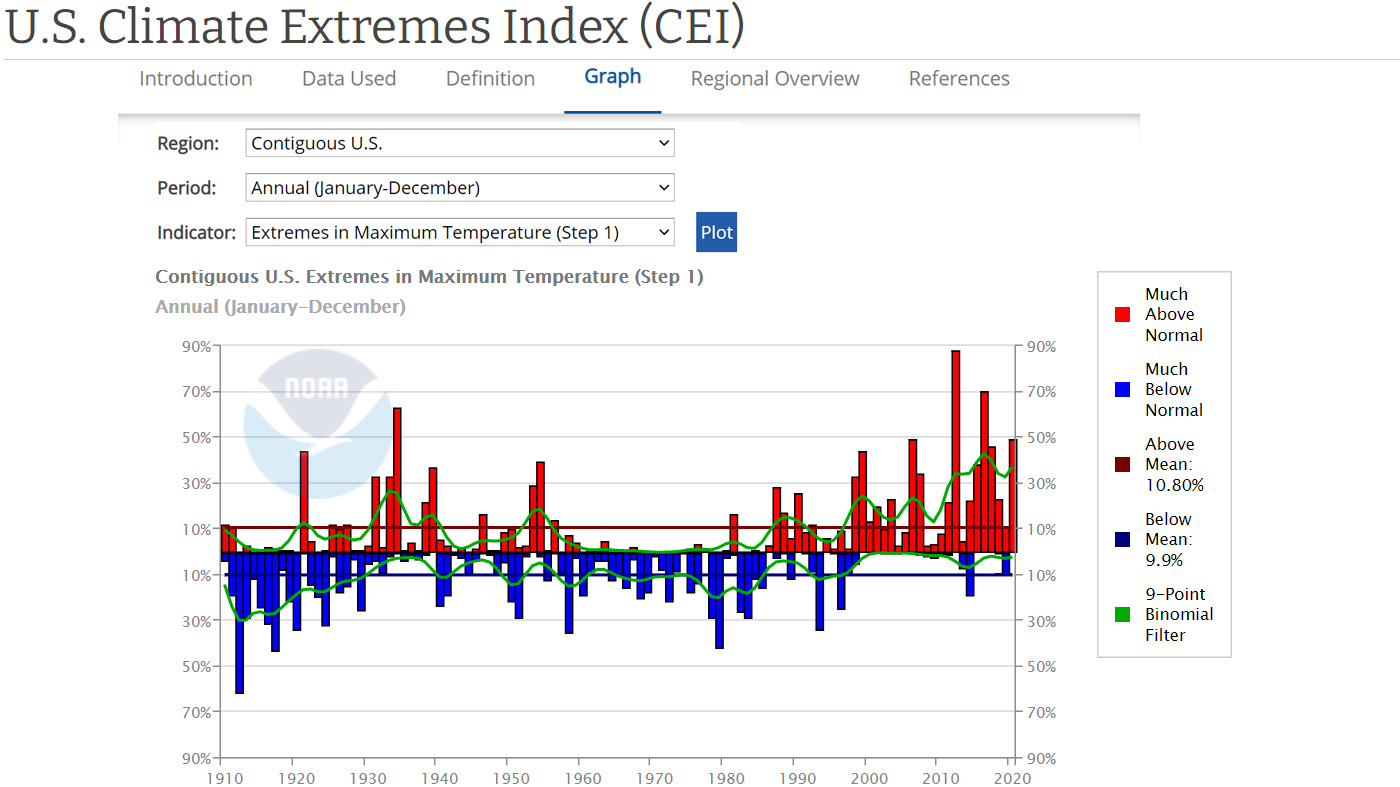
Documents the area of the contiguous United States (or a region therein) that experienced extreme conditions (as defined by the index) during various time periods.
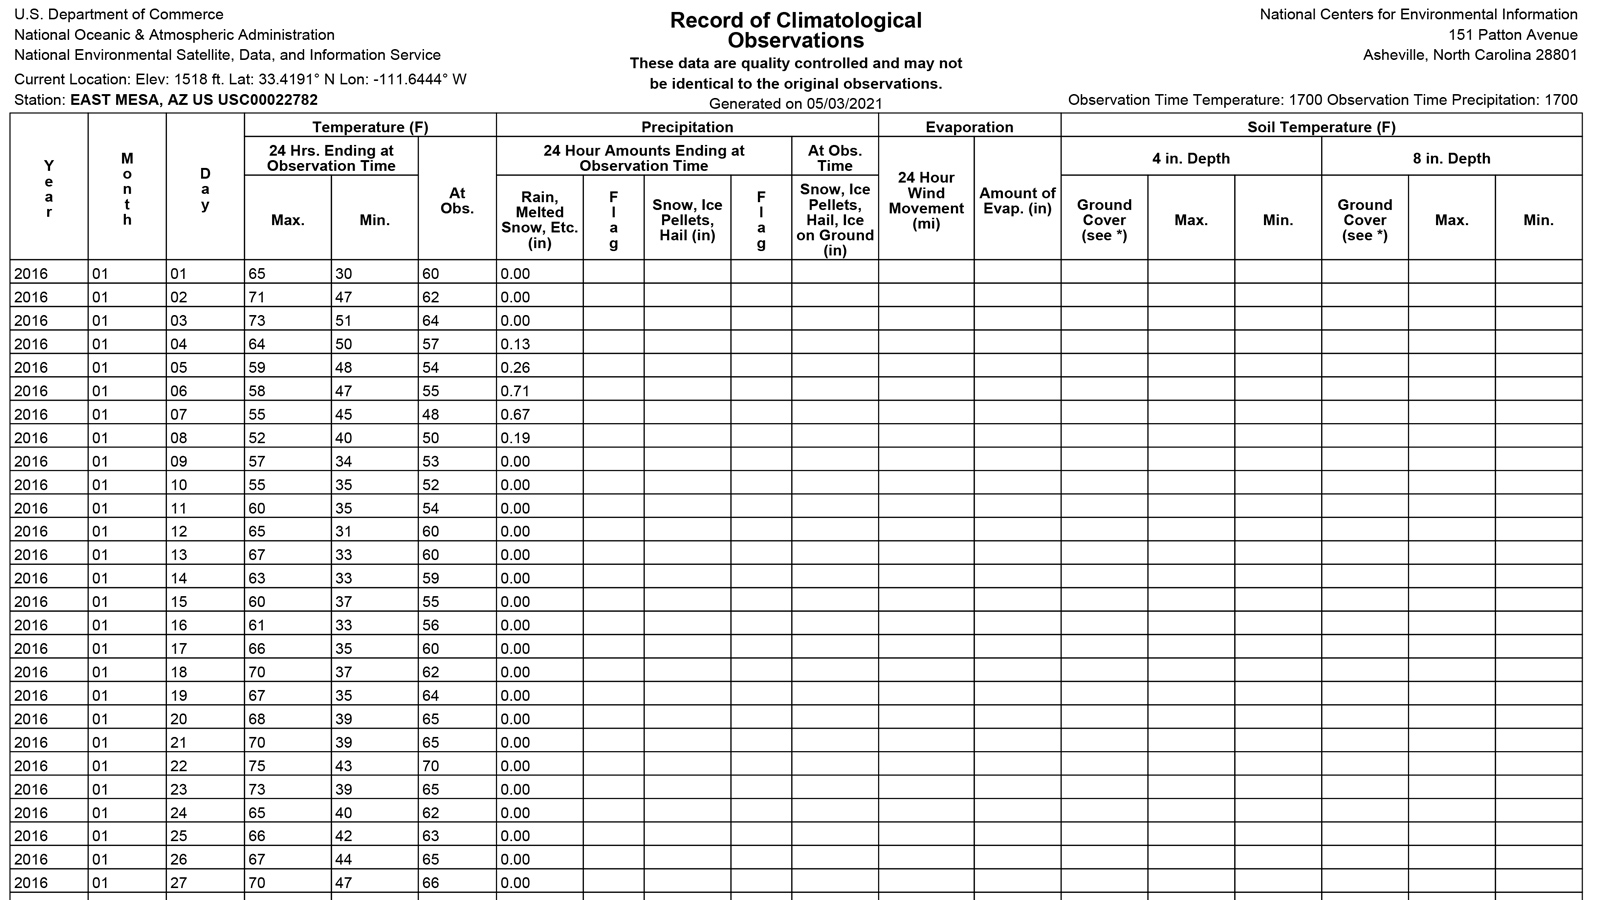
How much rain fell over the weekend? What was the temperature over the last few weeks? Tables of daily weather observations can answer these common questions.
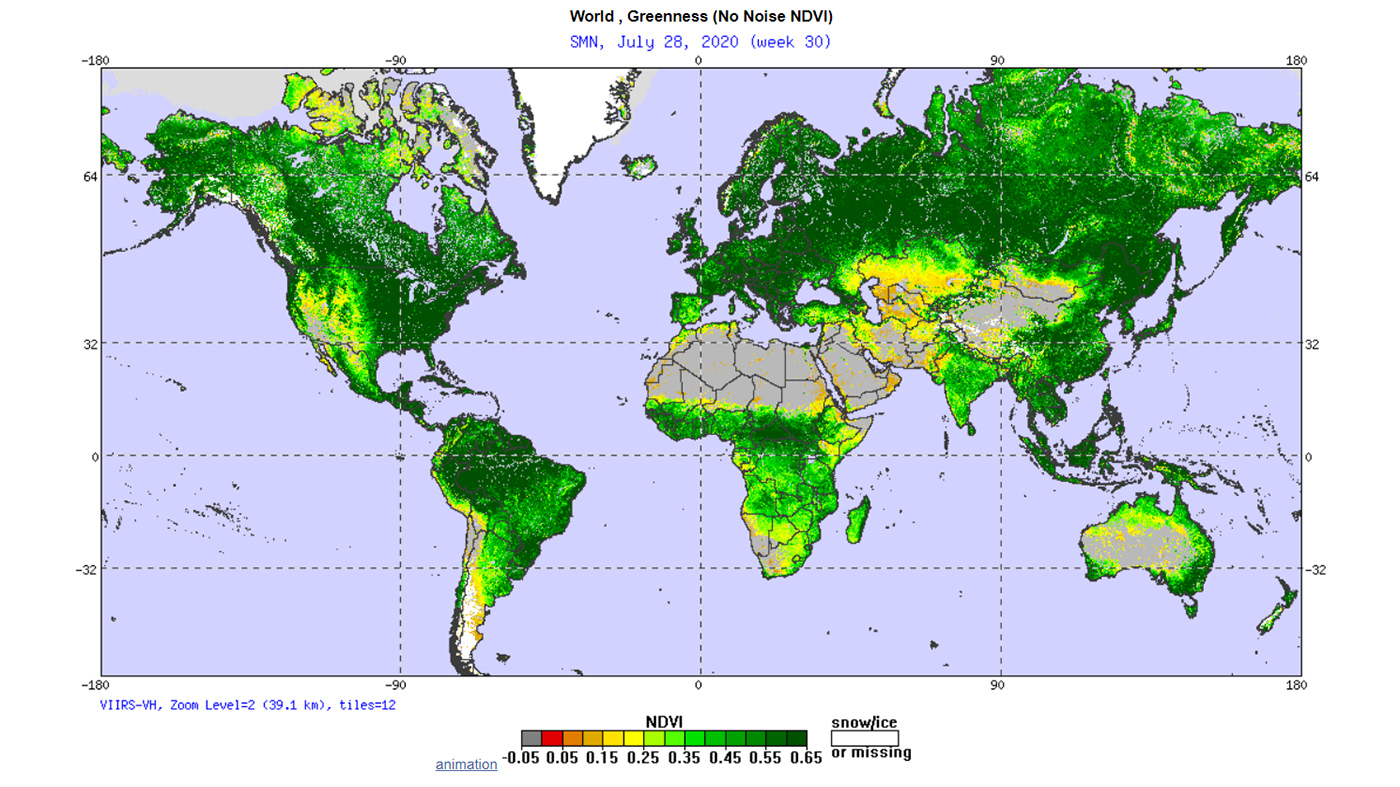
Maps of vegetation health products that allow us to monitor the status of vegetation around the world from space.
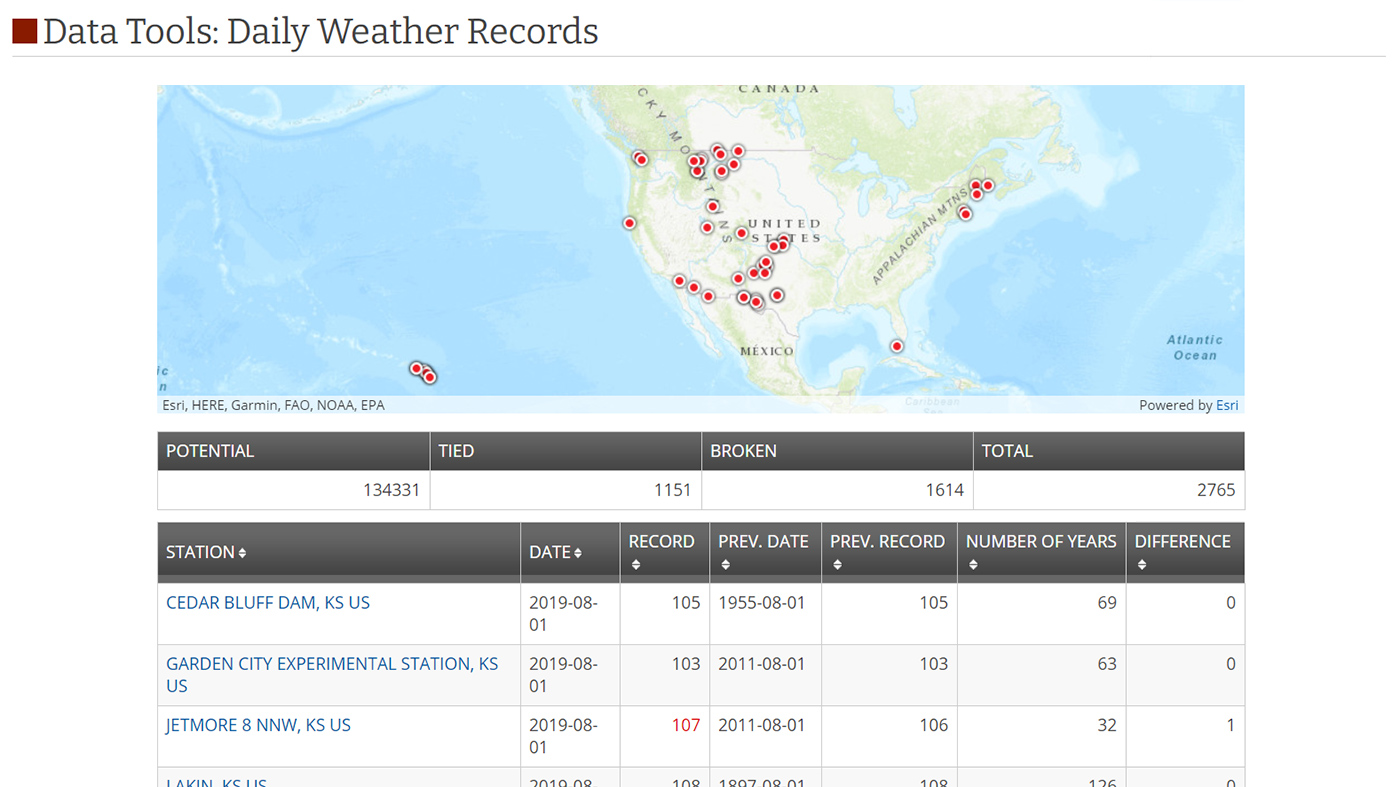
Explore the number of weather records broken over recent periods. Compare counts of temperature and precipitation records in the United States or across the globe.
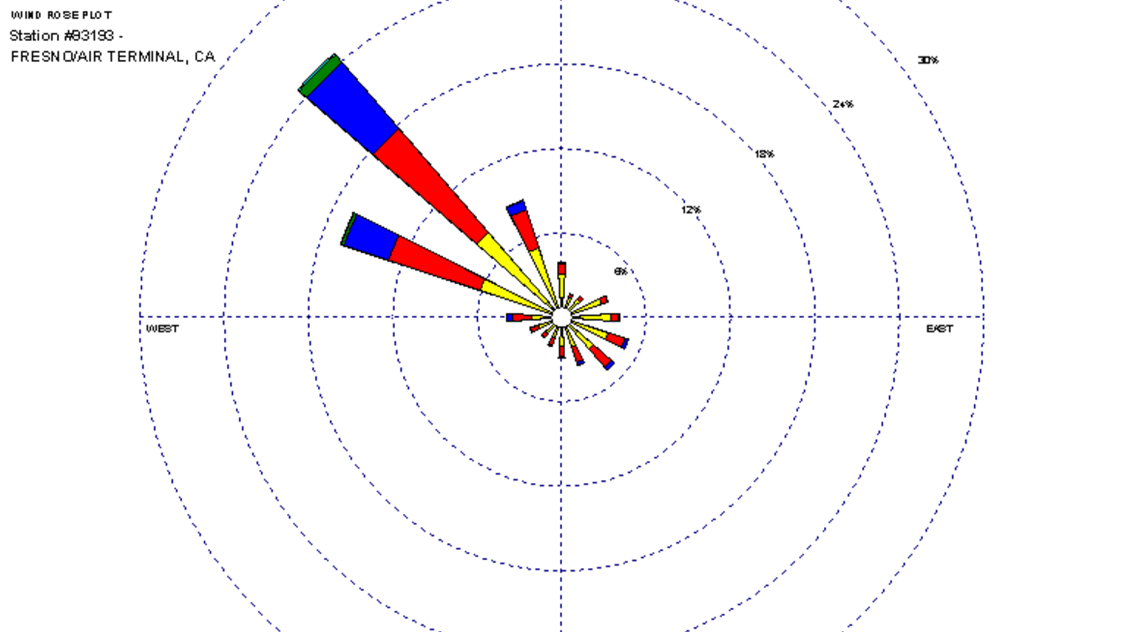
Monthly wind roses, which are plots that characterize the speed and direction of winds at a location, based on historical data.
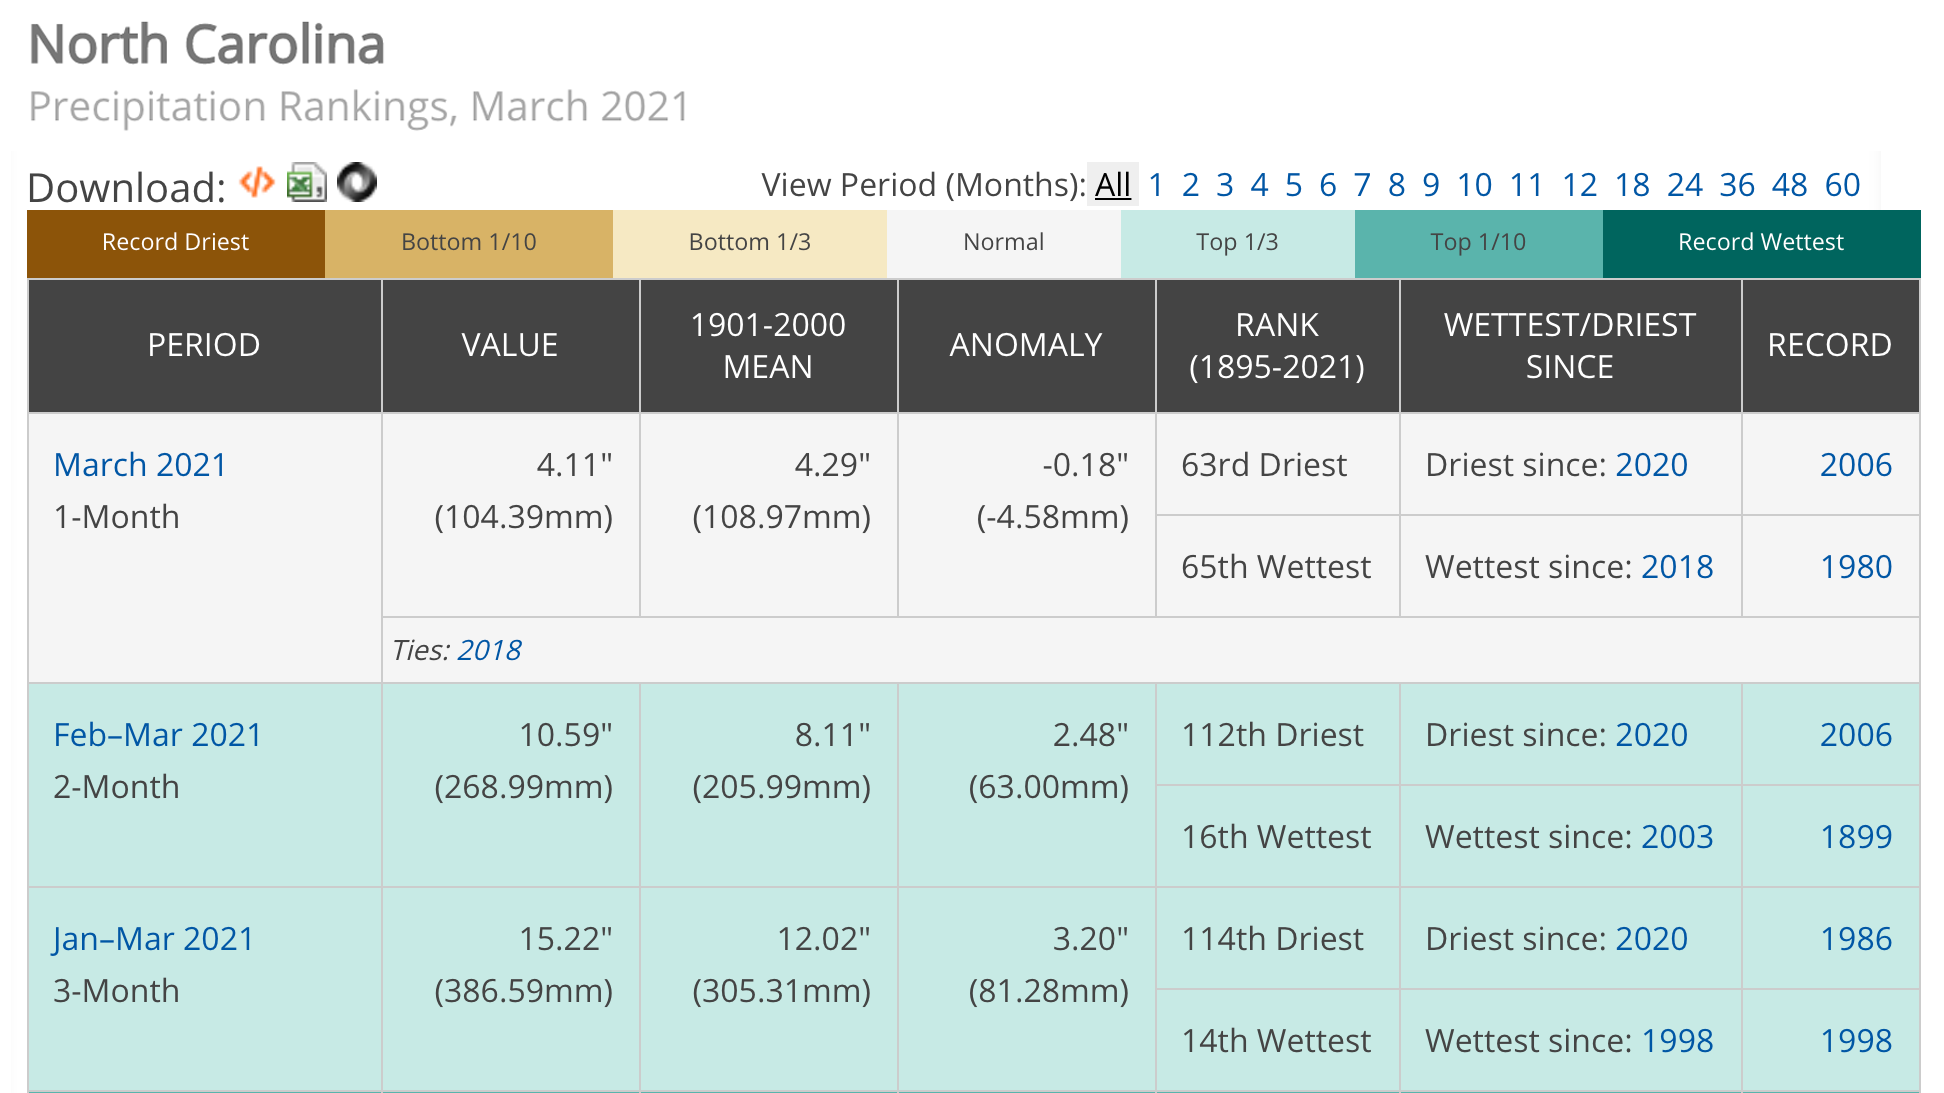
When you hear or see news that a region had its hottest or wettest month since records began, you can check the climatological record books yourself.
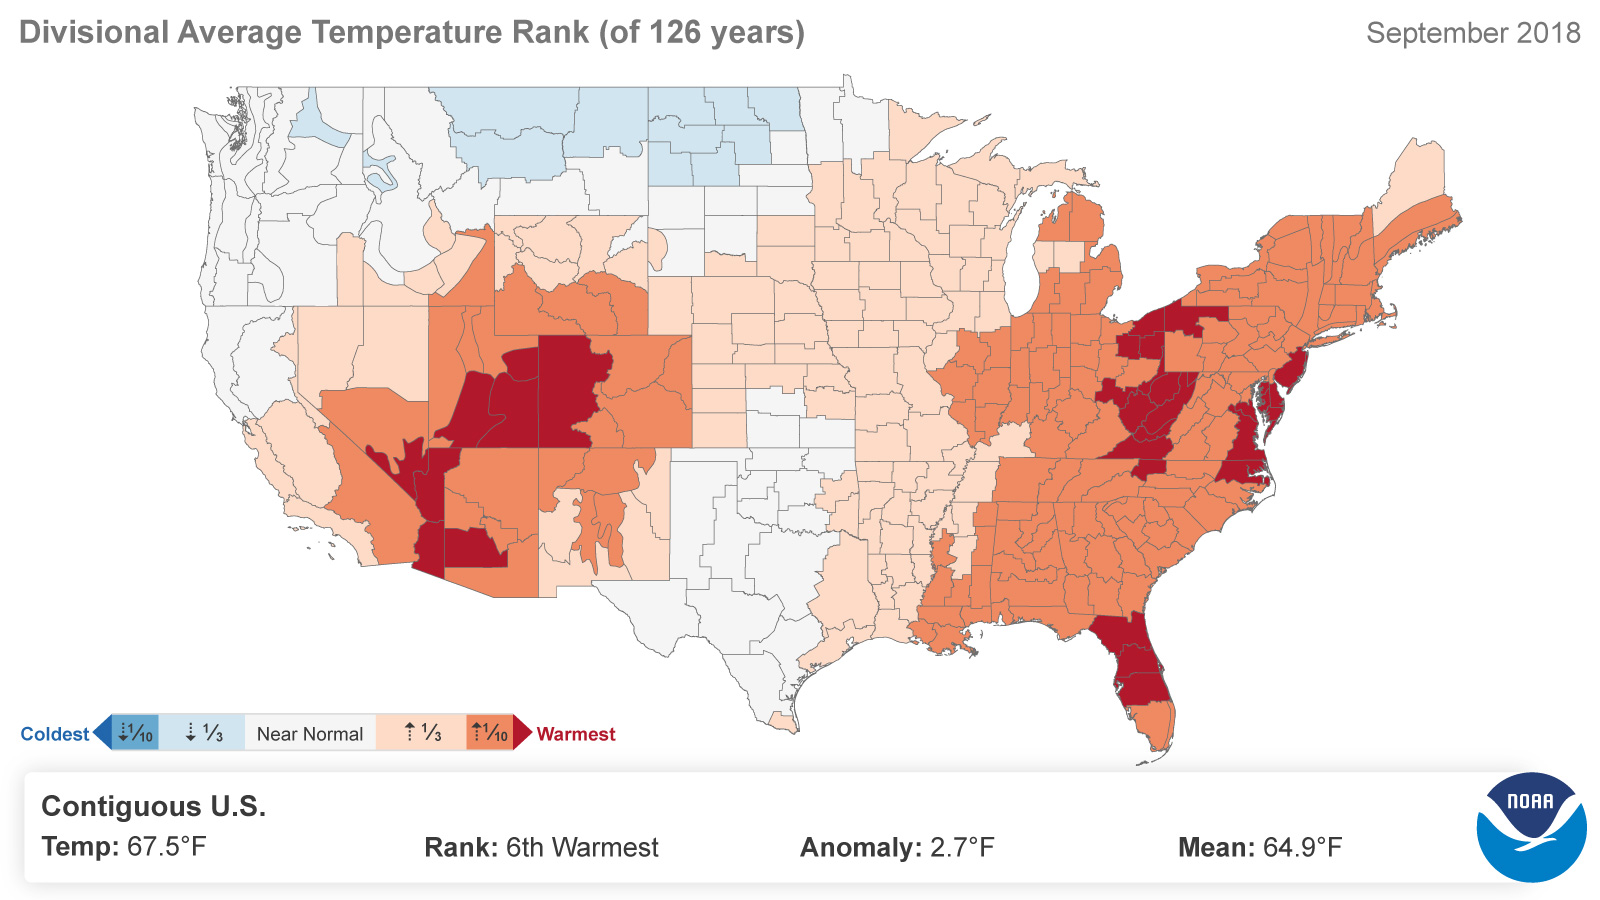
Generate maps showing data for each of the 344 climate divisions in the U.S. Climate Divisional Database.
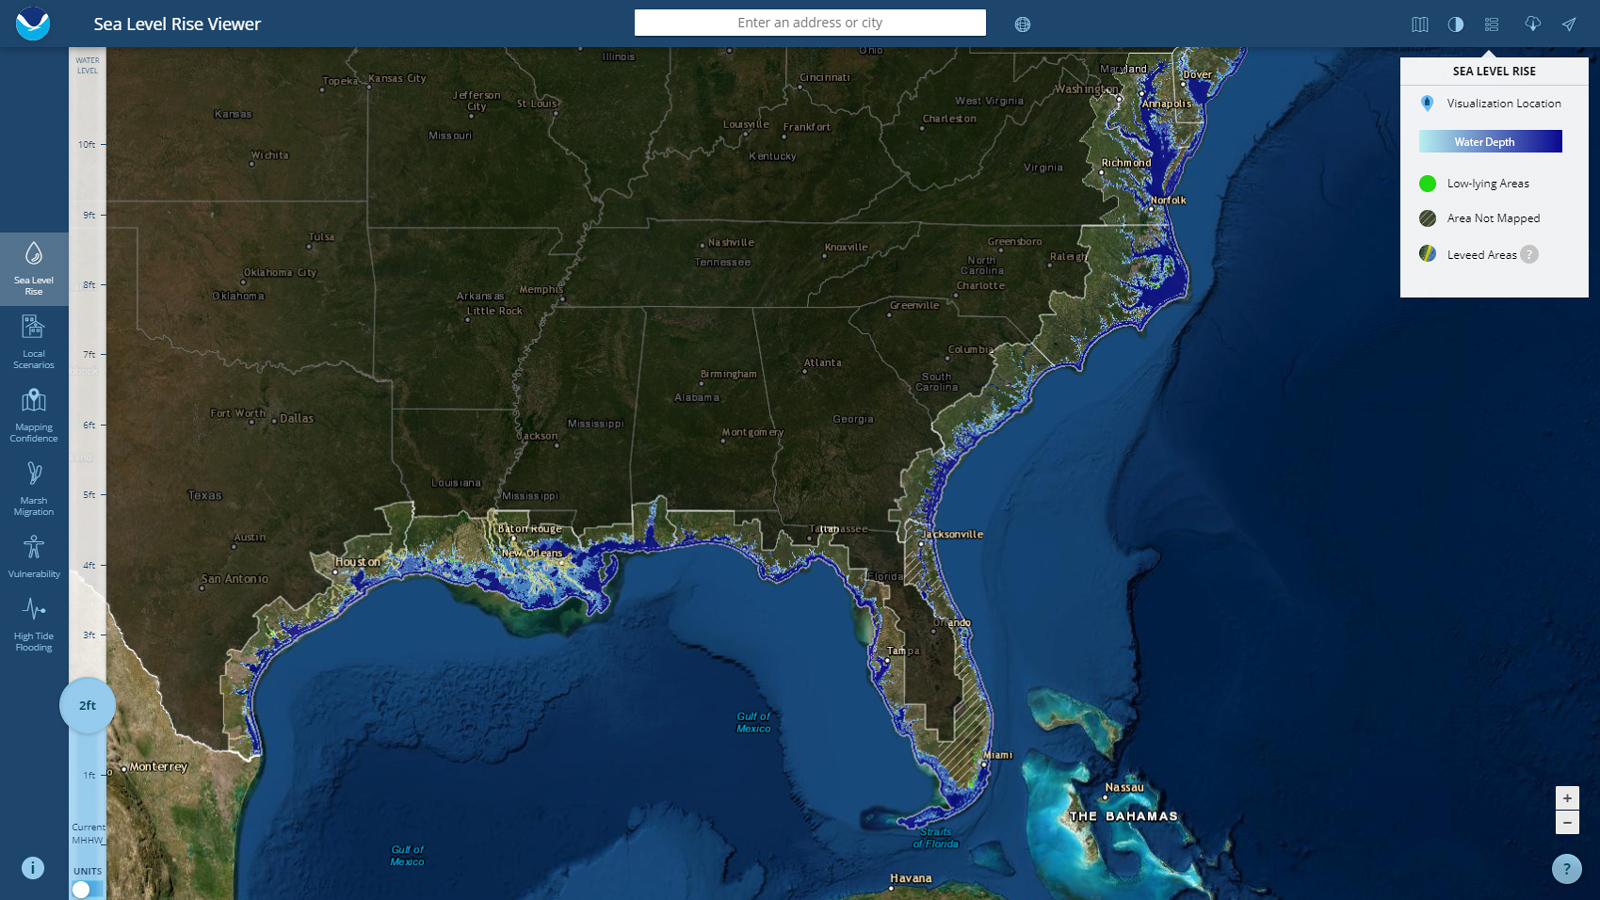
NOAA's Sea Level Rise map viewer gives users a way to visualize community-level impacts from coastal flooding or sea level rise (up to 10 feet above average high tides).
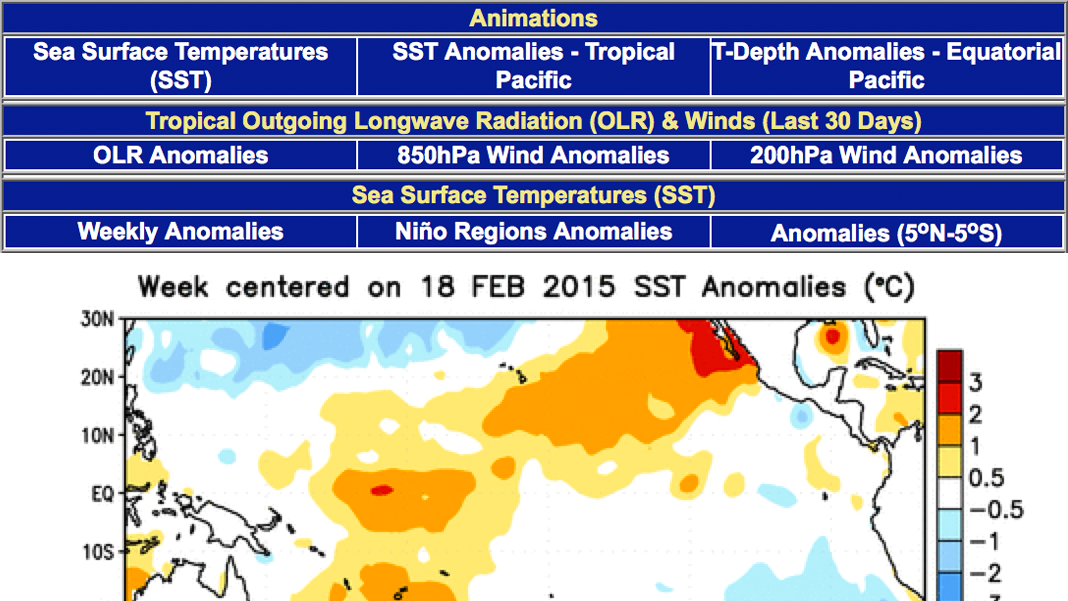
Current CPC information related to the El Niño-Southern Oscillation (ENSO), including technical information for forecasting impacts in the United States.