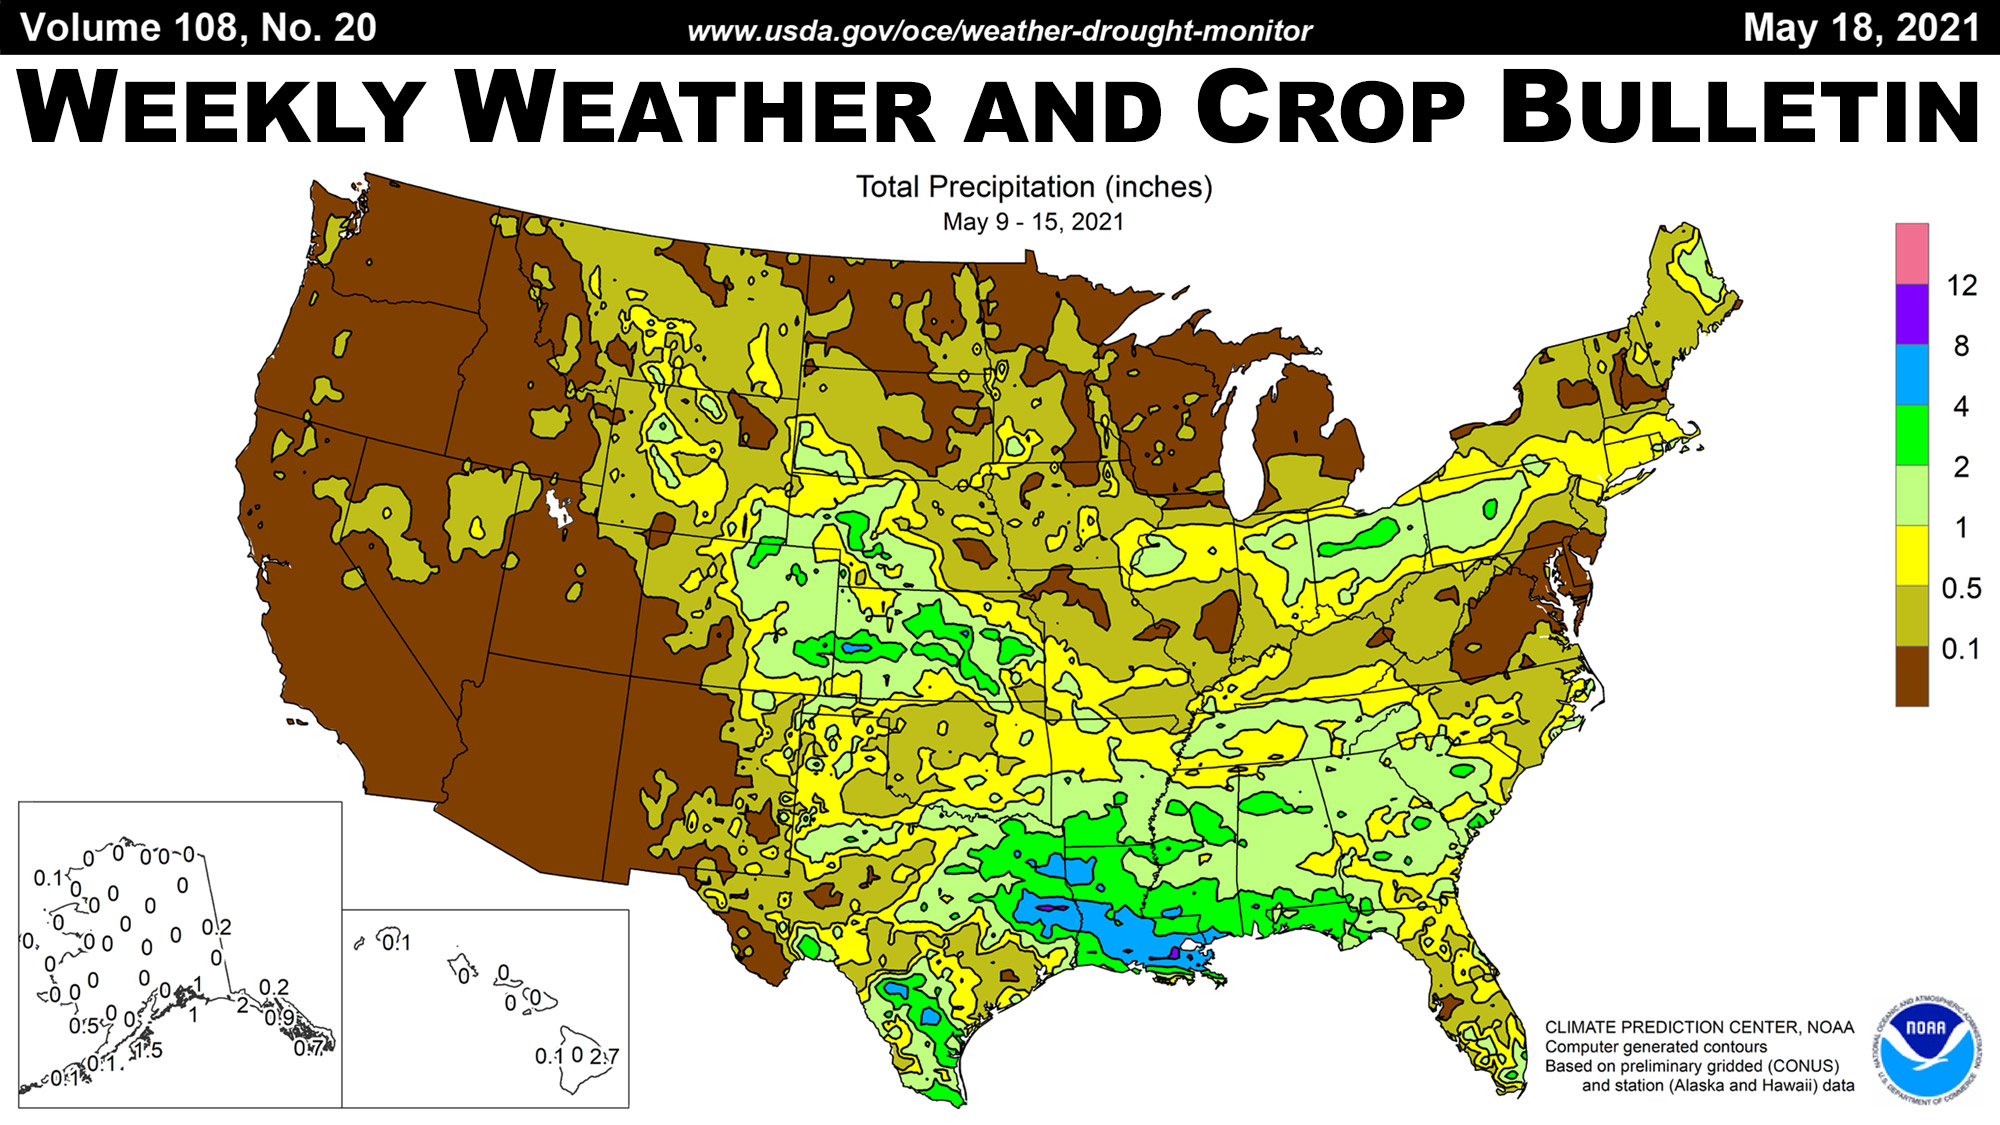
The Weekly Weather and Crop Bulletin (WWCB) provides a vital source of information on weather, climate, and agricultural developments worldwide, along with maps and charts appropriate for the season.
The Weekly Weather and Crop Bulletin (WWCB) provides a vital source of information on weather, climate, and agricultural developments worldwide, along with maps and charts appropriate for the season.
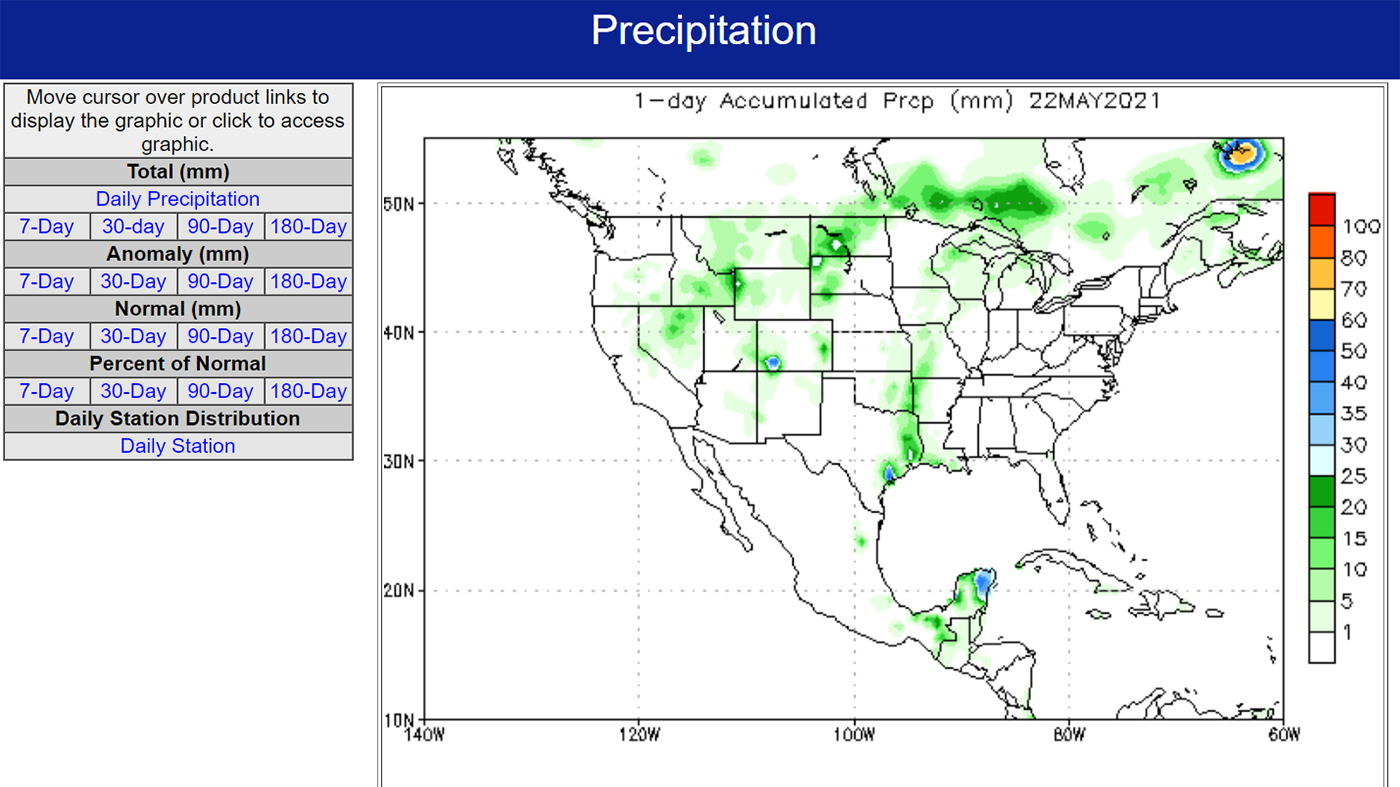
Large assortment of maps and charts that put precipitation and temperatures into context by showing how recent conditions compare to long-term climate averages.
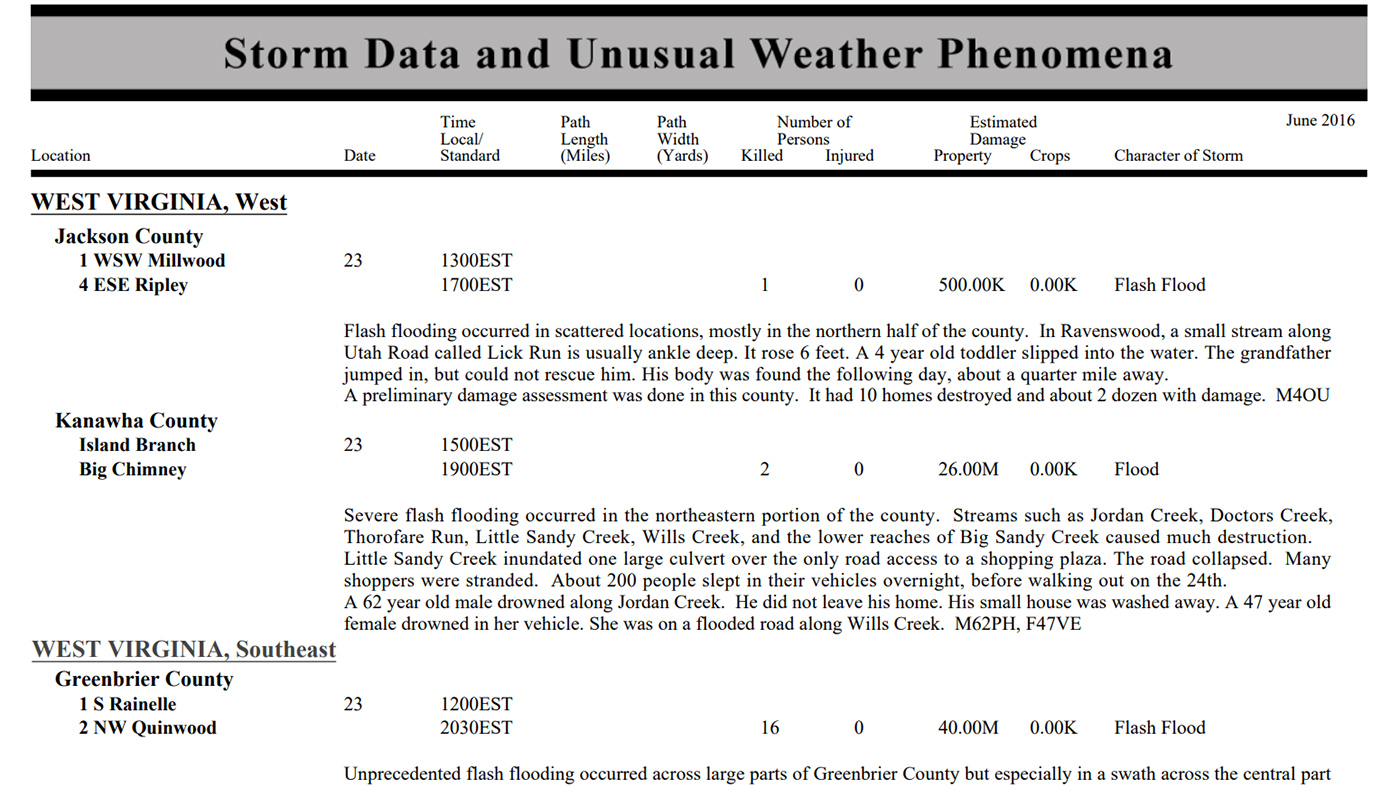
Monthly publication containing a chronological listing, by state, of storms and unusual weather phenomena. Reports contain information on storm paths, deaths, injuries, and property damage.
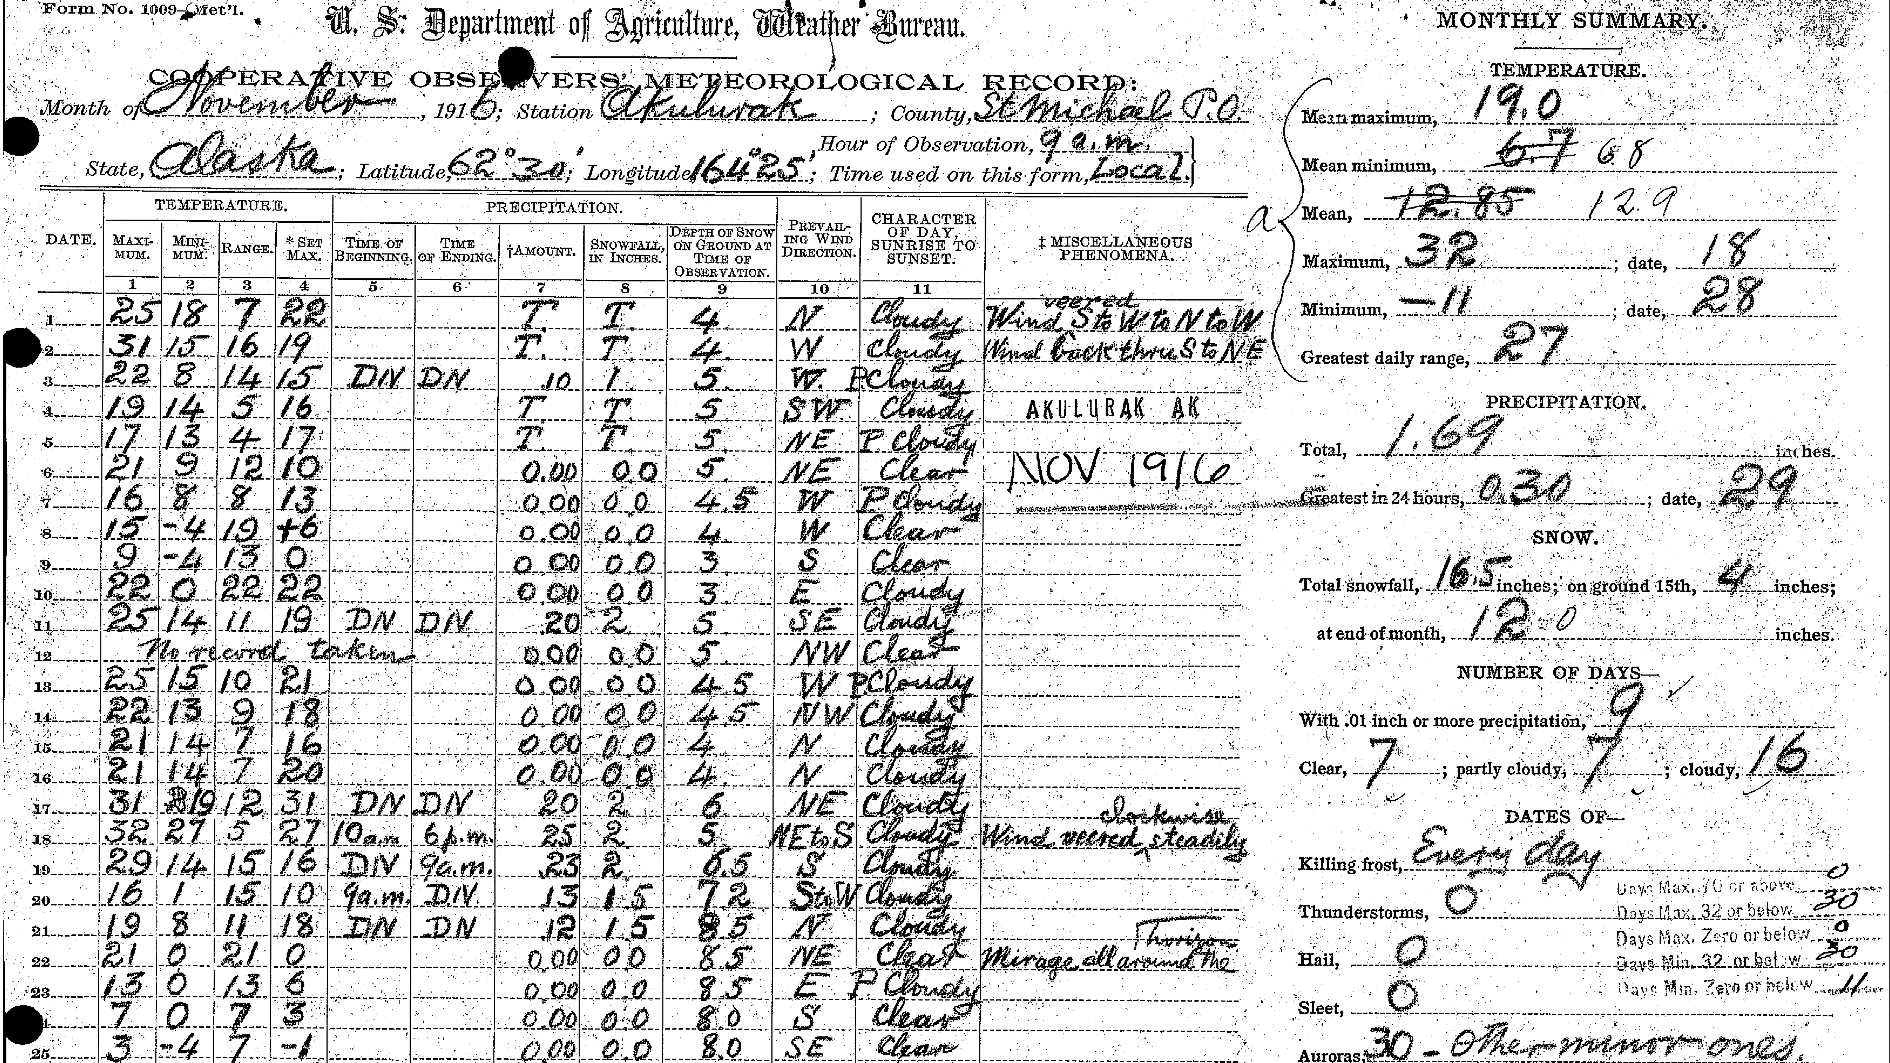
Through the National Weather Service (NWS) Cooperative Observer Program (COOP), more than 10,000 volunteers take daily weather observations.
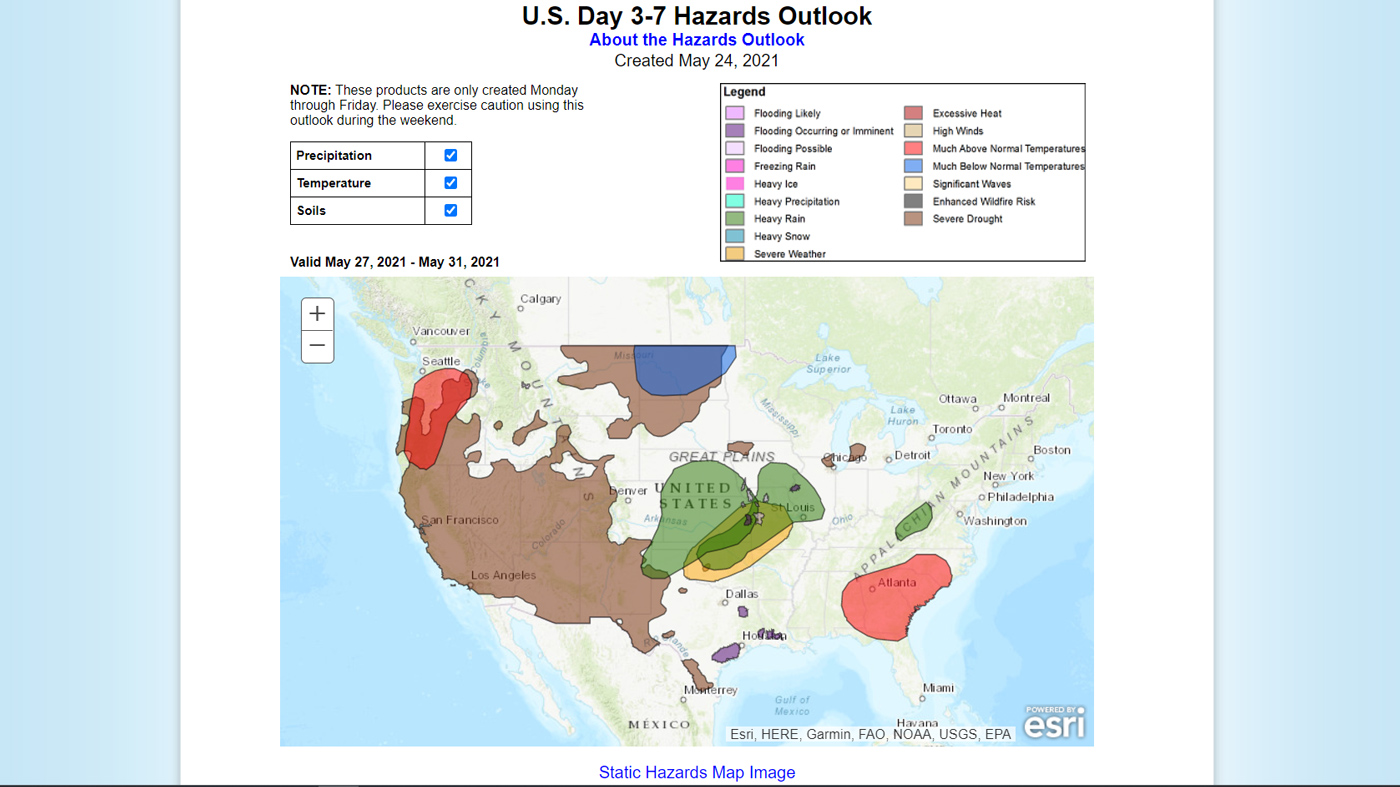
Monday through Friday of each week, NOAA's Climate Prediction Center issues an outlook of U.S. weather- and climate-related hazards for the next eight to fourteen days.
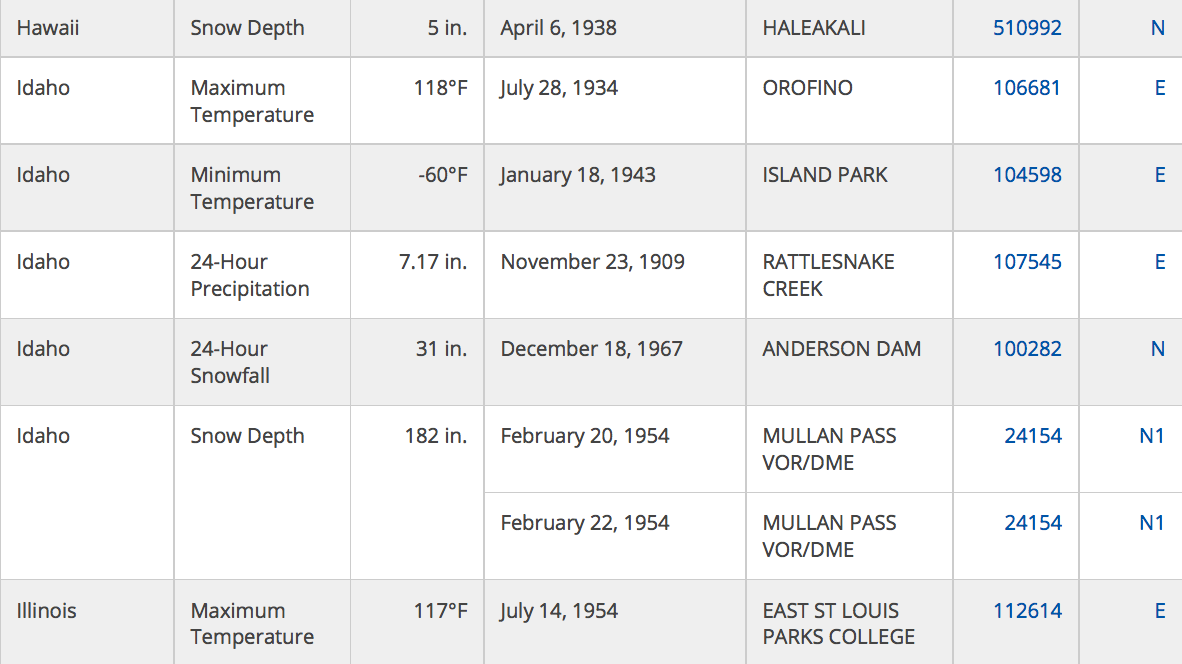
Records for every state in categories such as temperature, total amount of rain or snow in 24 hours, weight and diameter of hail-stones, and highest wind gusts.
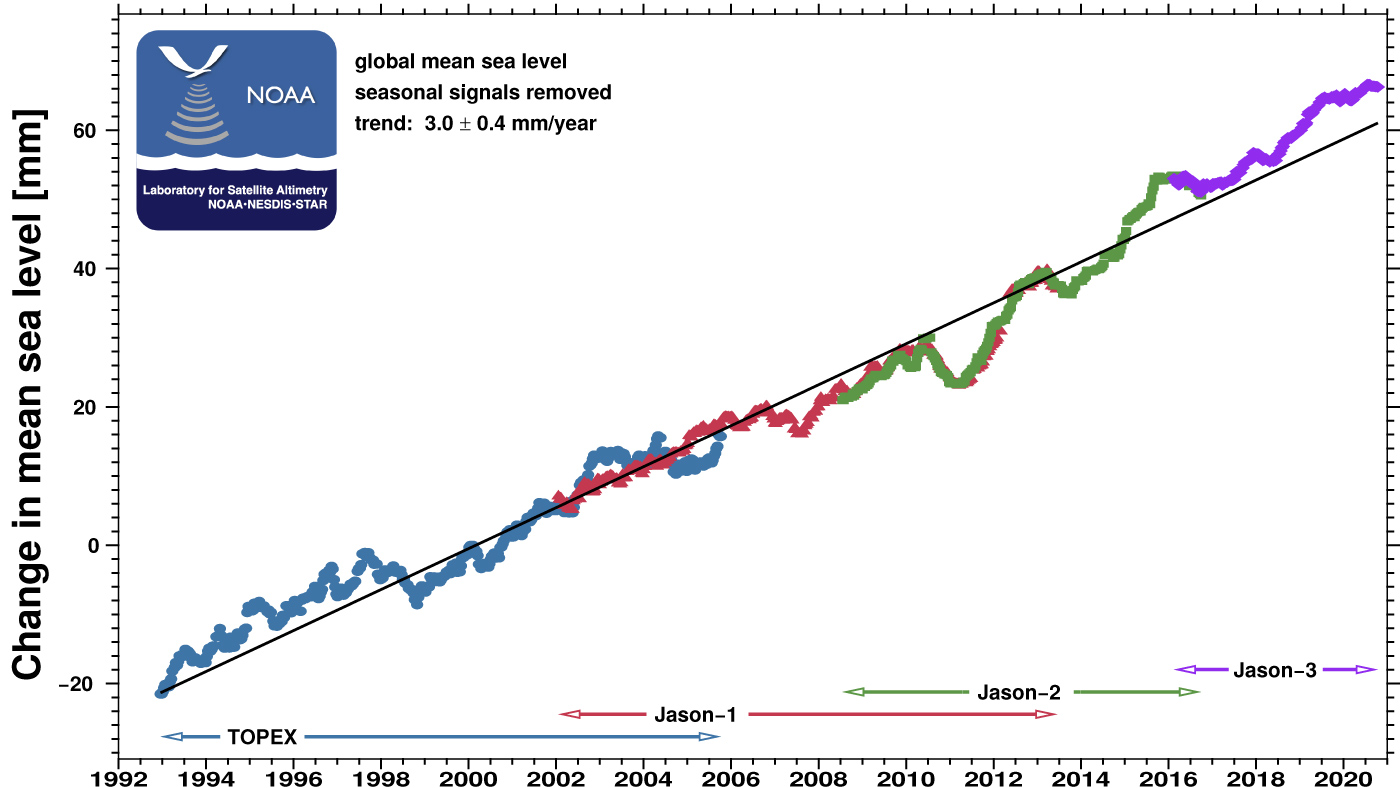
Global and regional estimates of sea level rise based on measurements from satellite radar altimeters, continuously checked against a network of tide gauges.
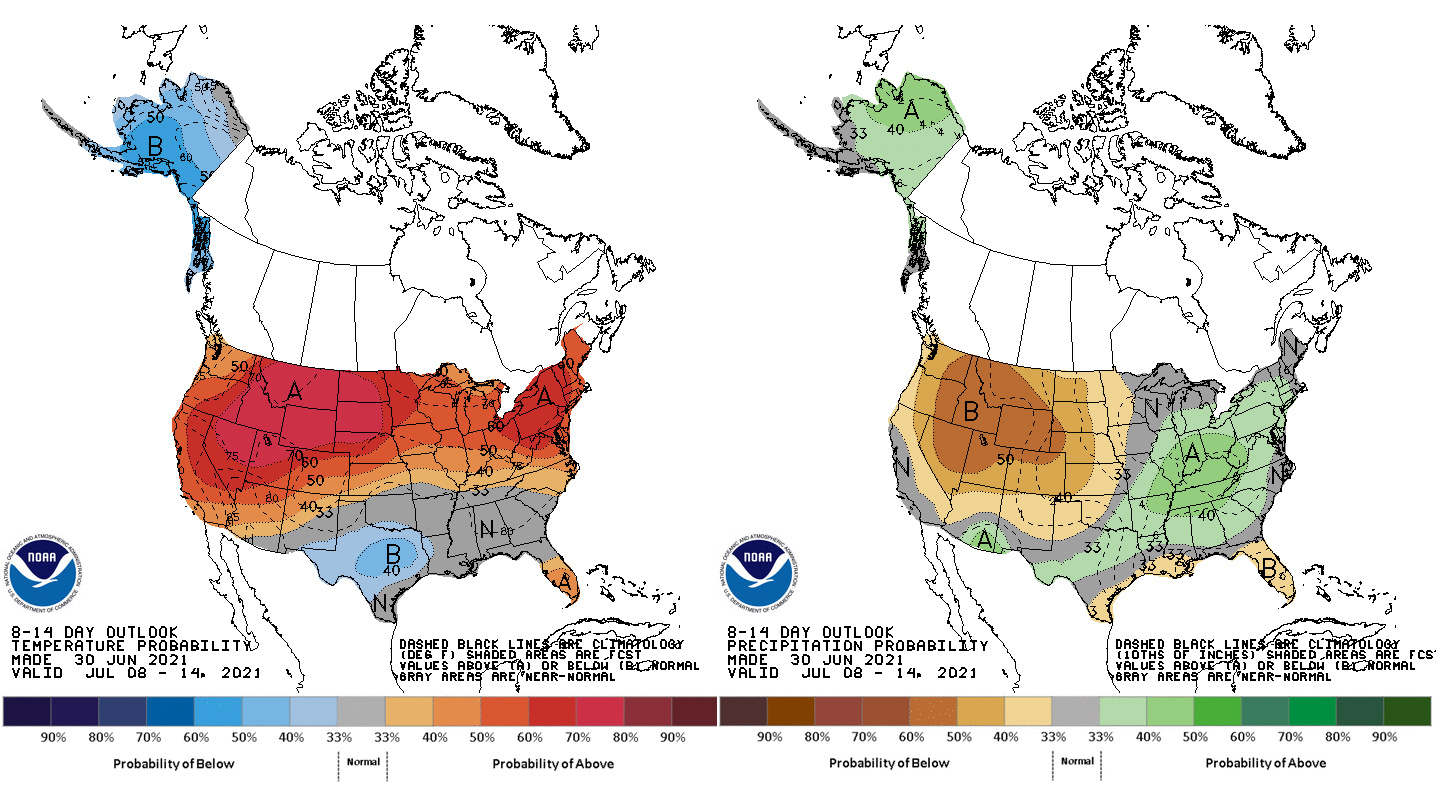
Climate outlook maps describe the chances that conditions will be below-normal, near-normal, or above-normal for the future outlook period indicated.
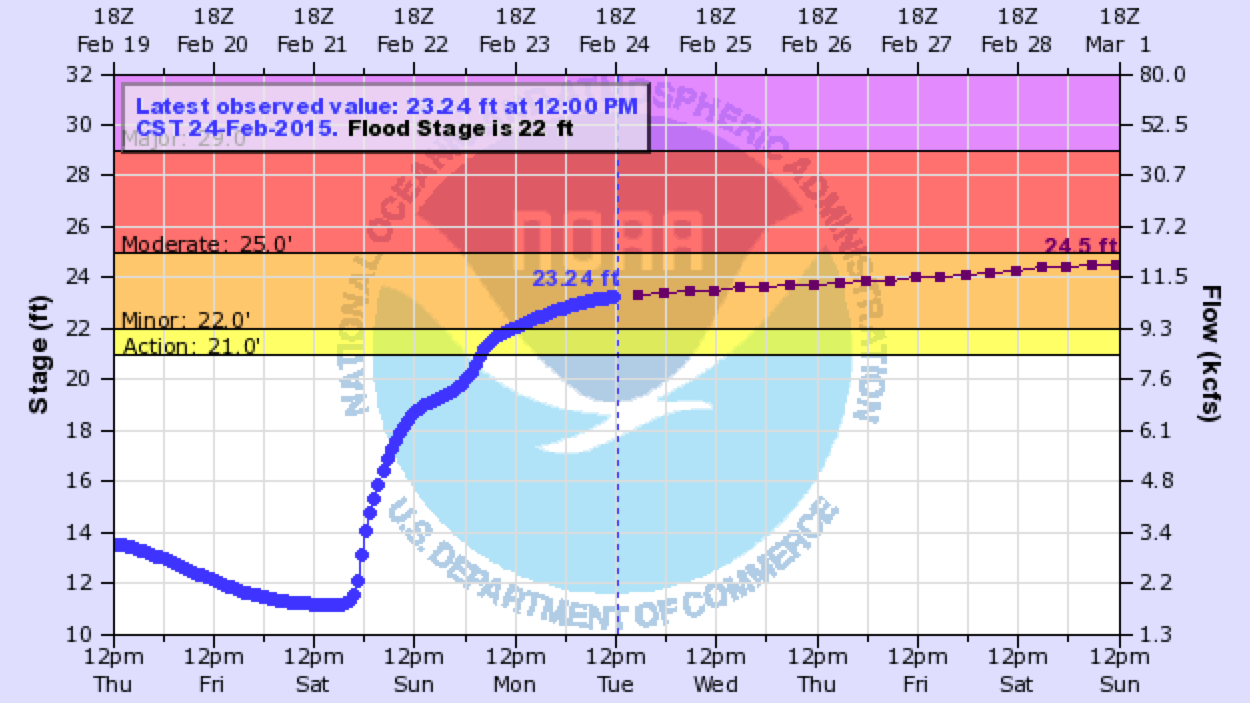
A color-coded map indicating current river levels or flood stages for more than 6,500 streamgages in U.S. states and territories.
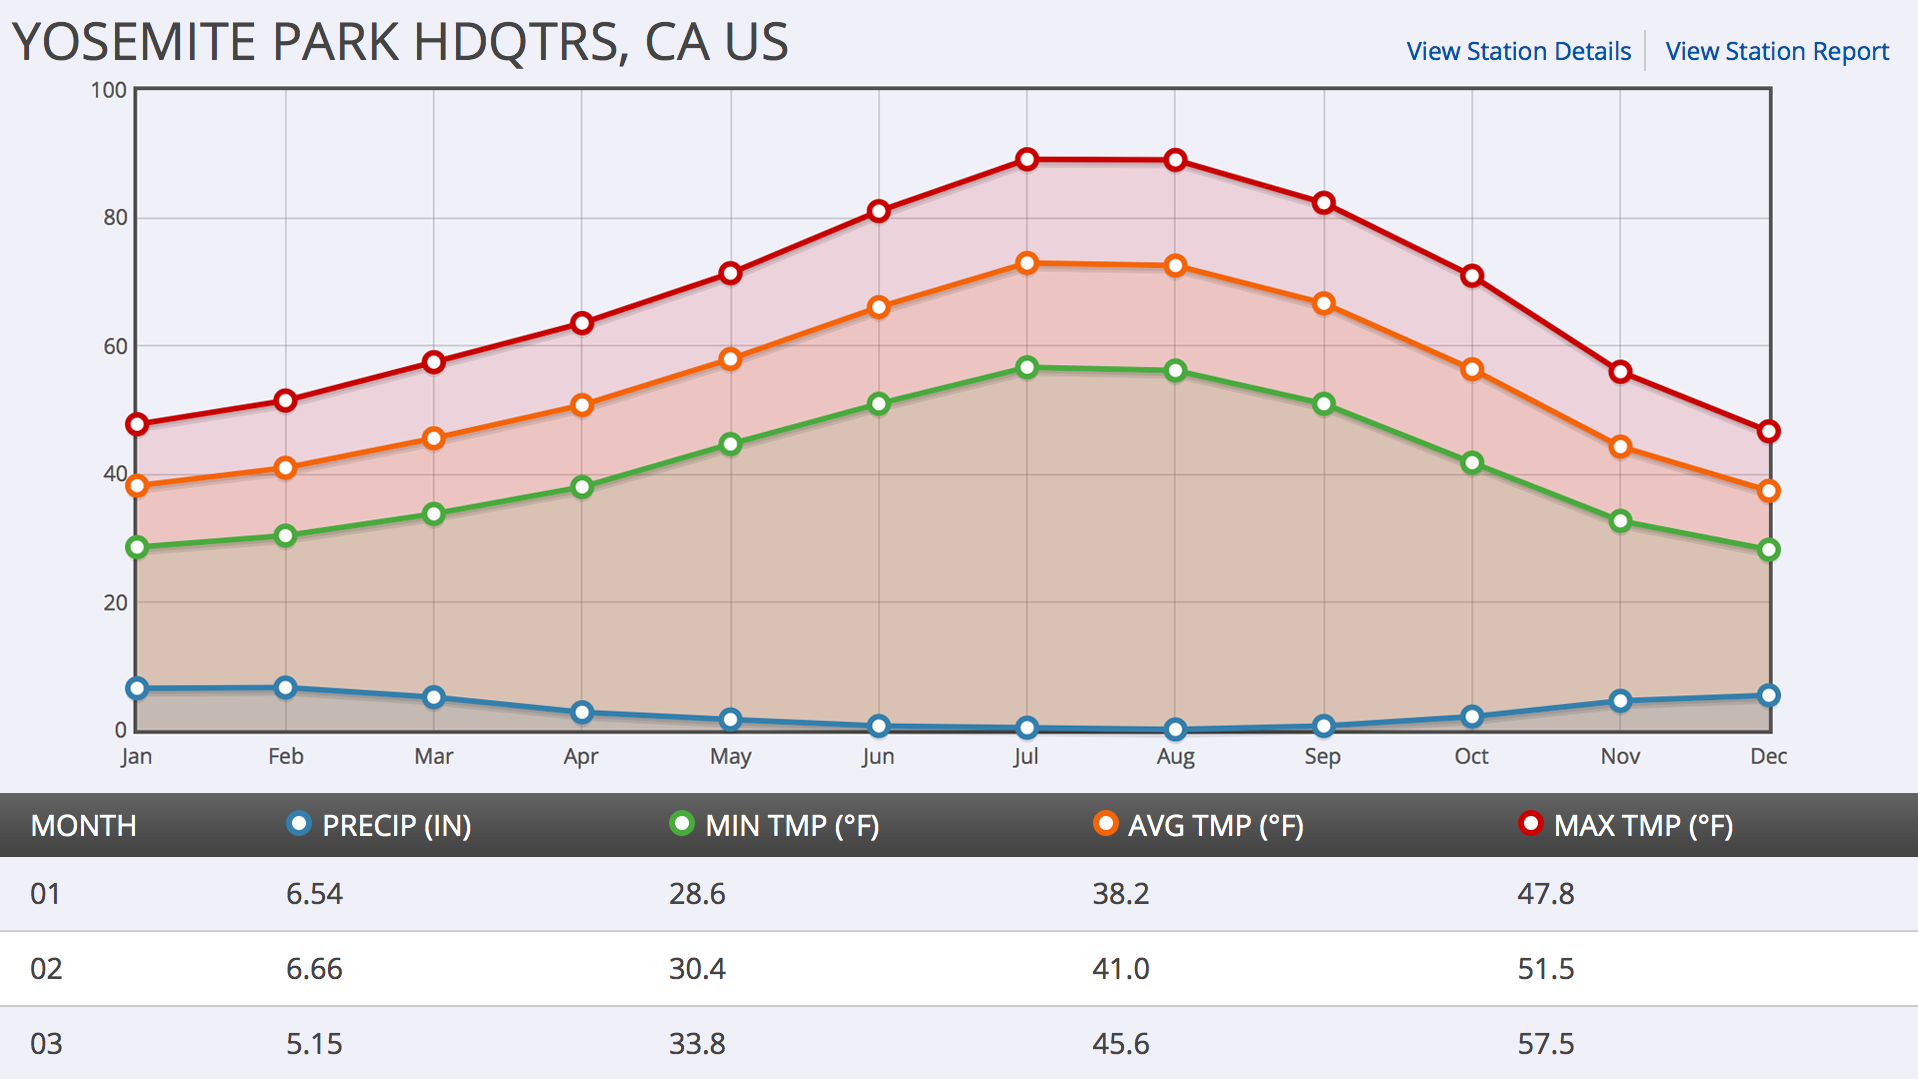
Simple graphs of Climate Normal data for temperature and precipitation are one way to show a location's climate throughout the year, month, or day.