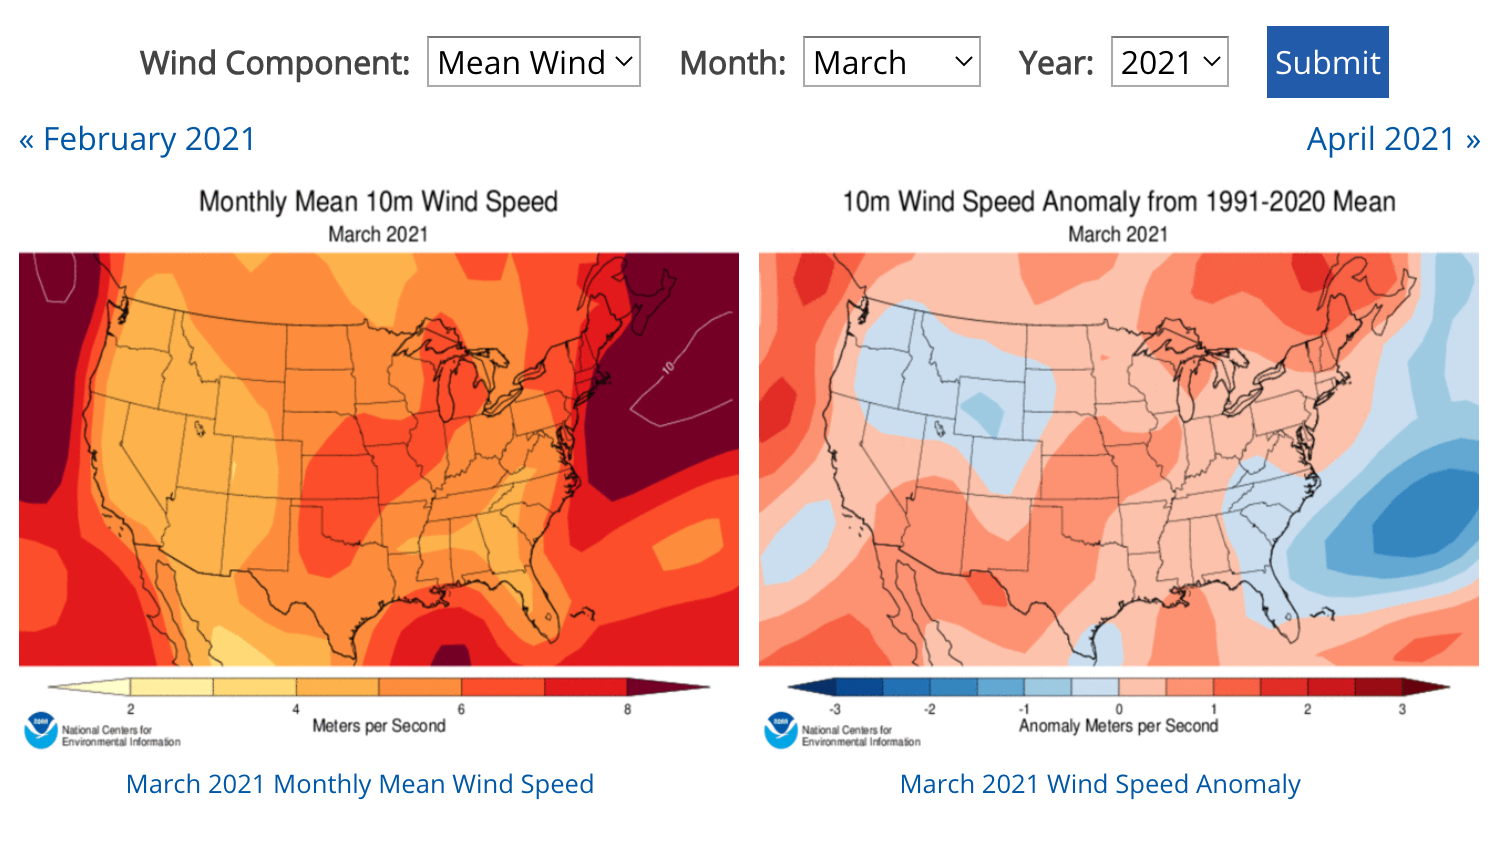
View maps of average monthly wind speed and direction for the contiguous United States from 1979 to the present.
View maps of average monthly wind speed and direction for the contiguous United States from 1979 to the present.
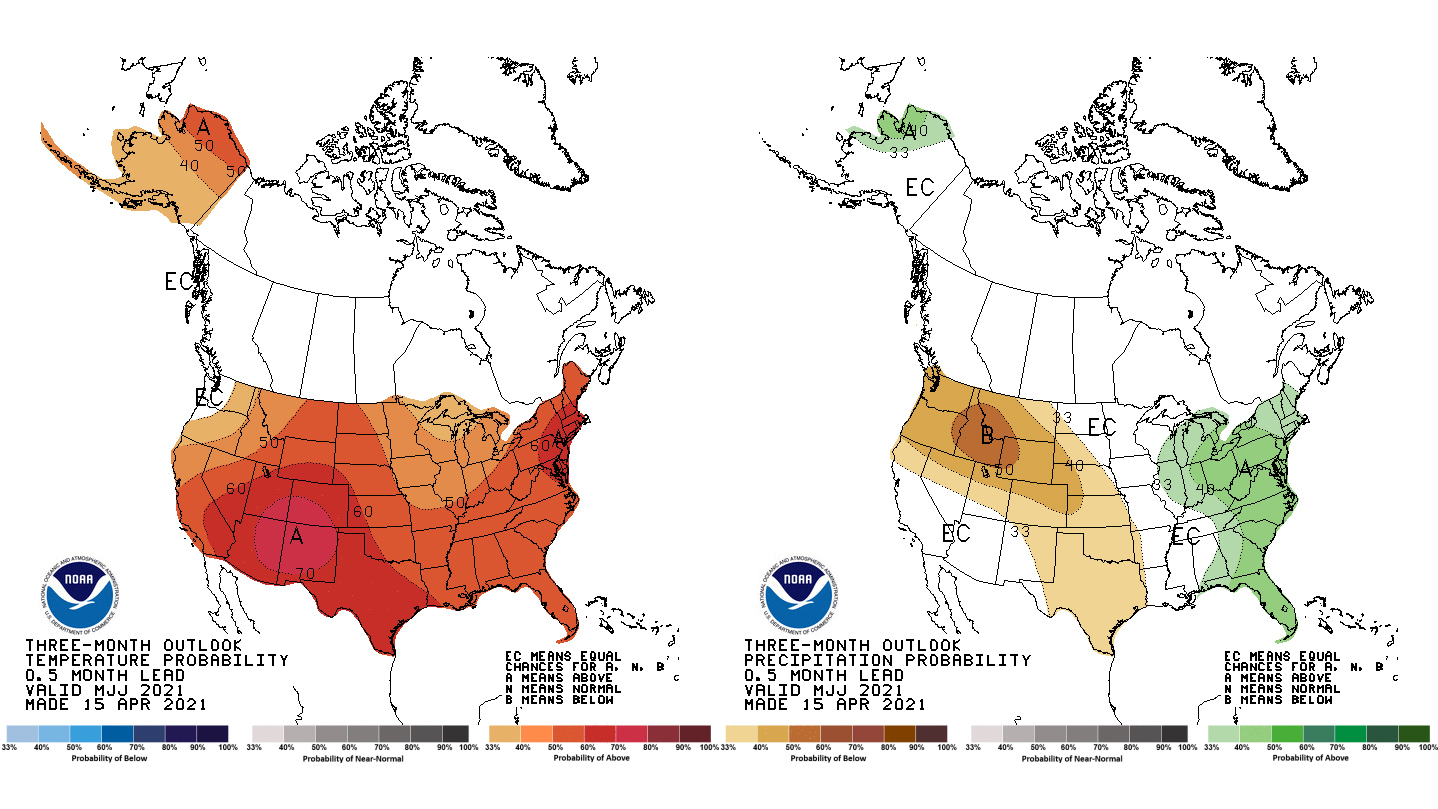
Climatologists use historical and current climate and weather data make climate predictions for temperature and precipitation in the future. These outlook products are different from weather forecasts.
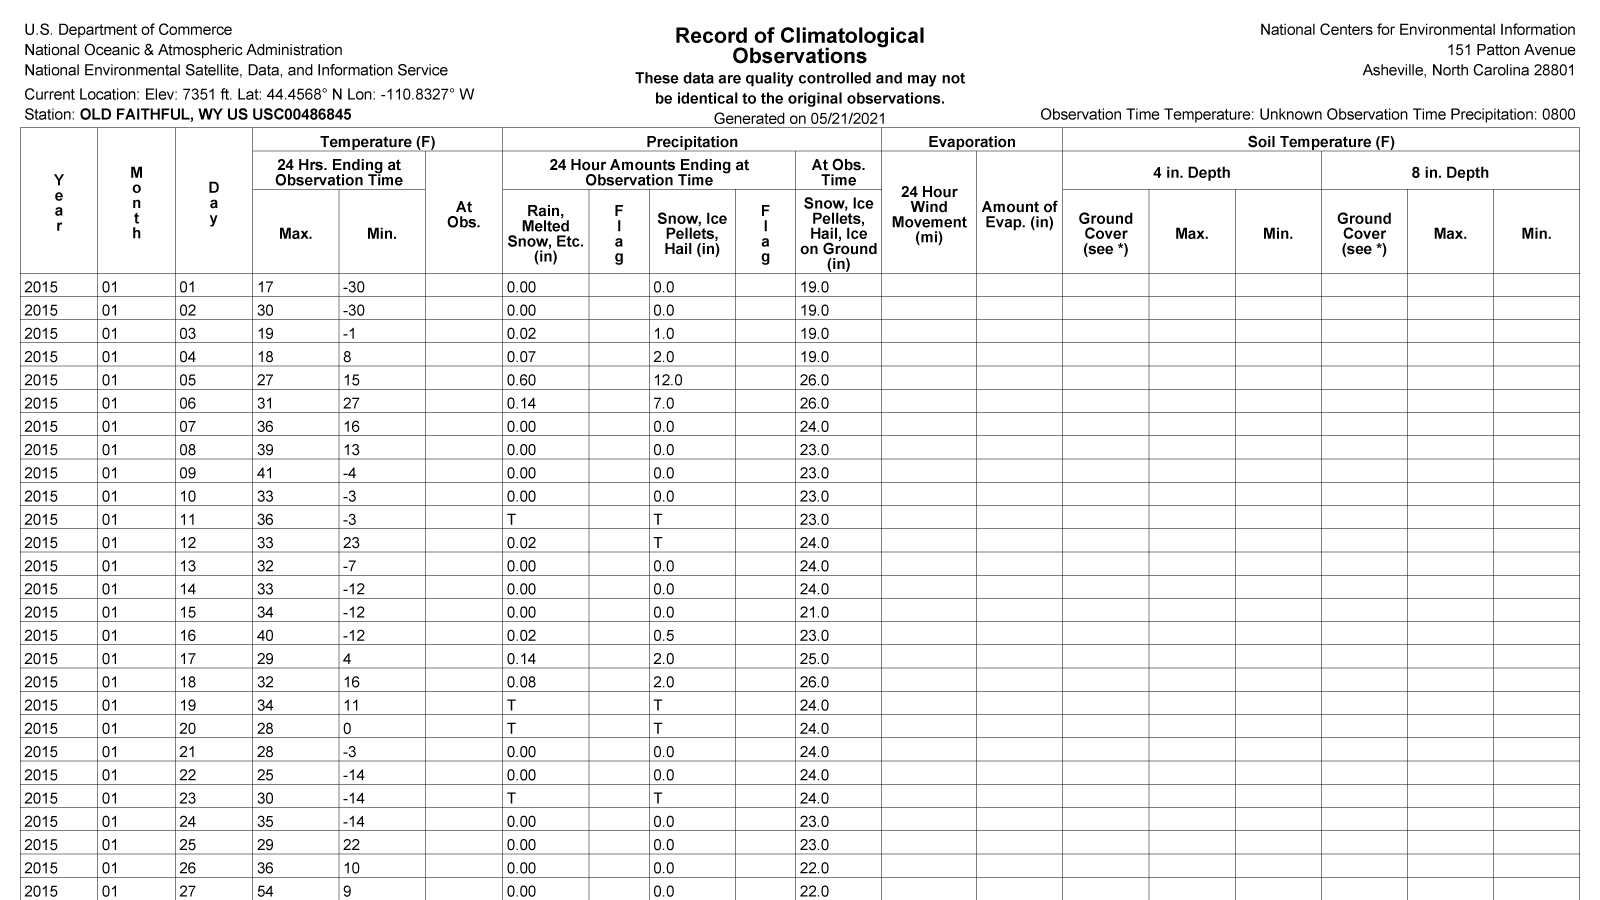
Daily GHCN summaries answer questions such as, what were the high and low temperatures at a station on a specific day; how much did it rain last Wednesday; or how much snow was on the ground on a recent date?
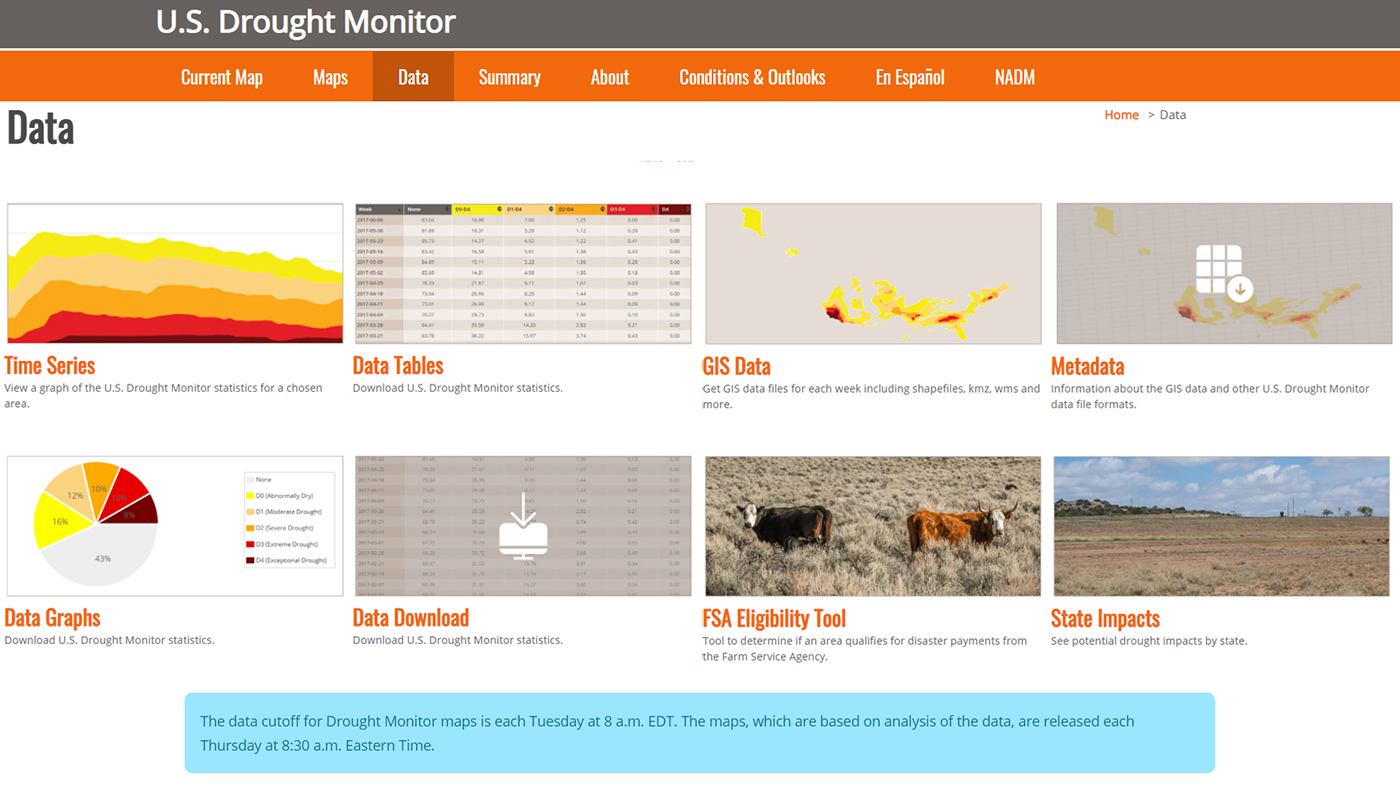
The Drought Risk Atlas provides historic data about drought for weather stations across the United States that have at least 40 years of records.
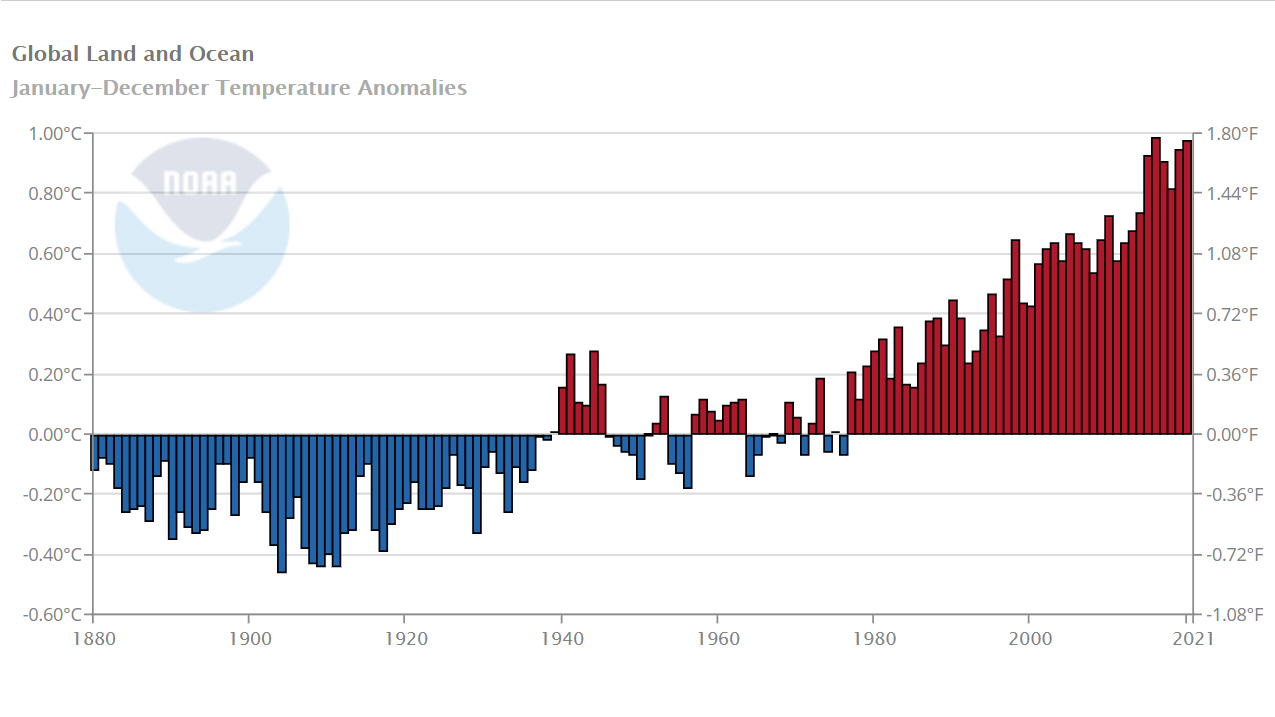
Time series of global surface temperatures for land, ocean, or land and ocean combined compared to long-term climate averages.
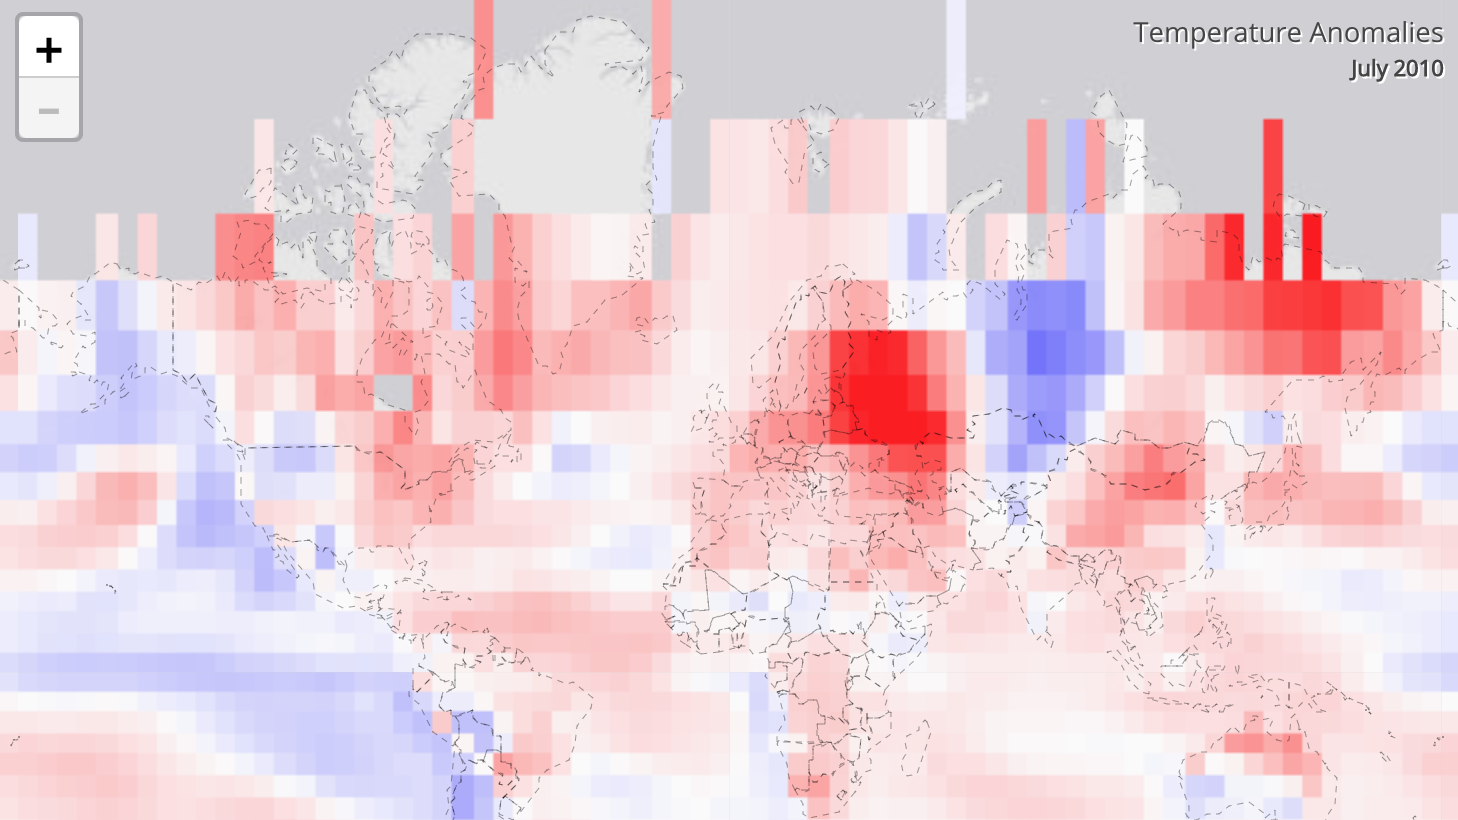
Global surface temperature anomaly maps, available at the NOAA Climate at a Glance website, based on the 1981-2010 mean.
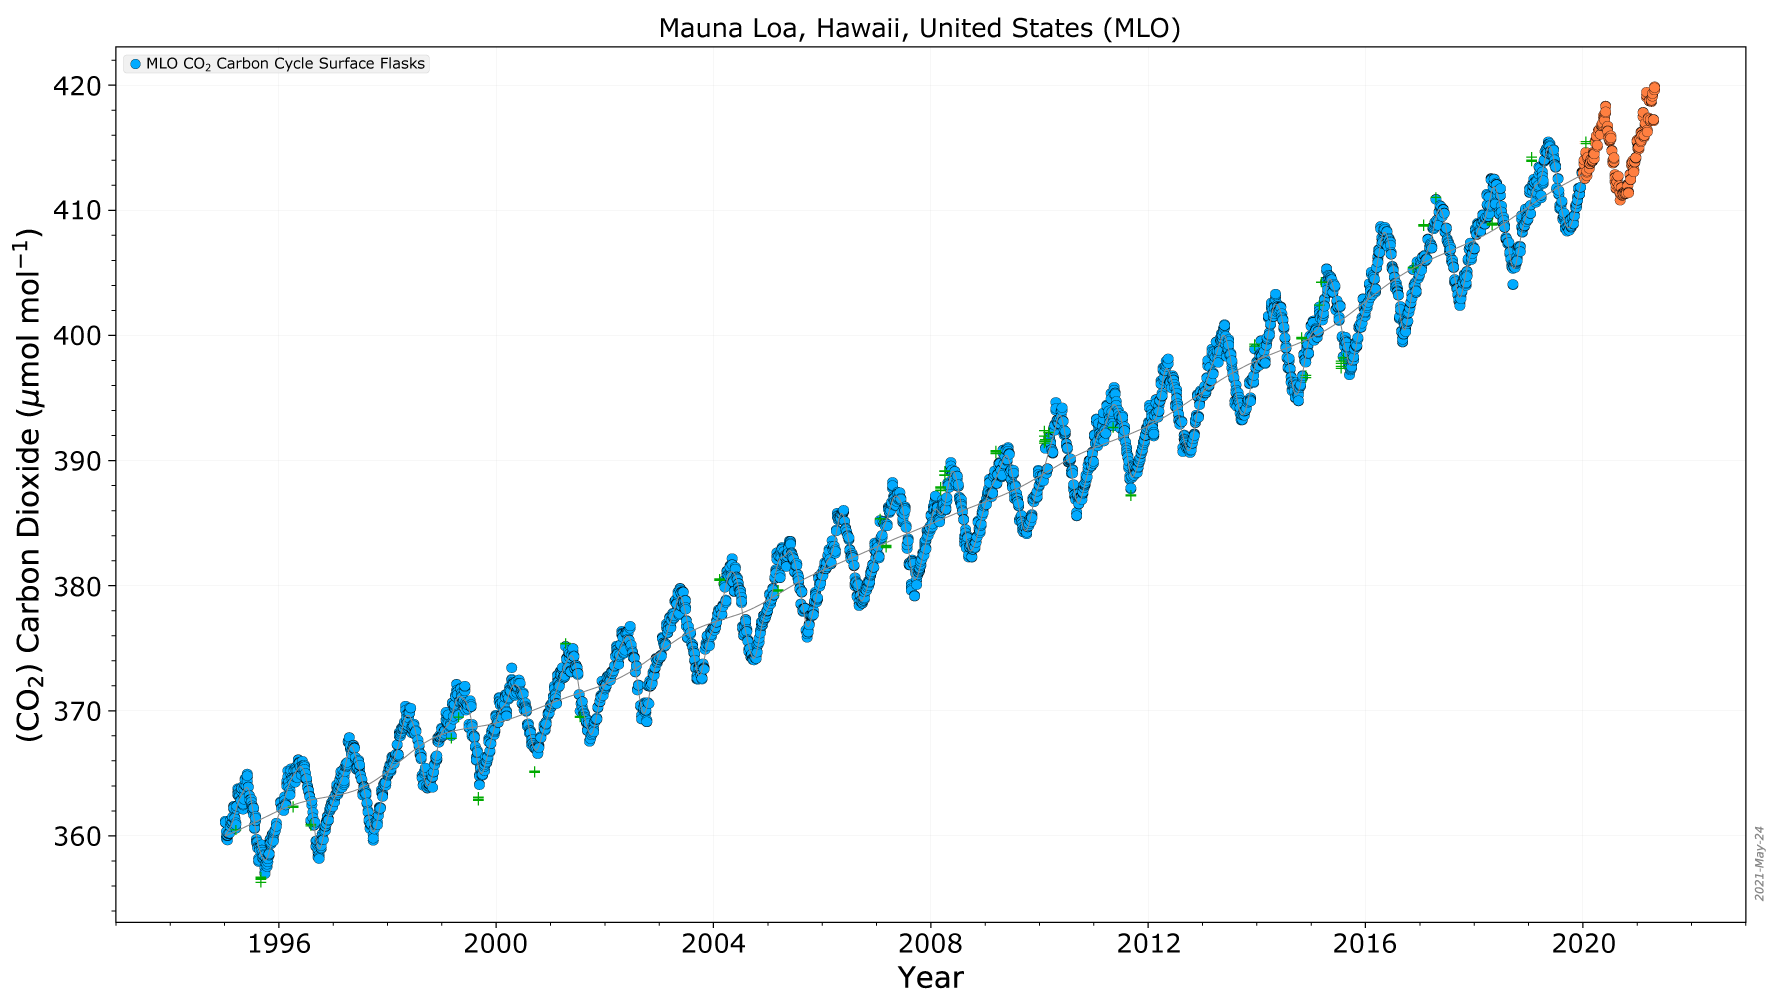
The Interactive Data Visualization tool gives users a way to explore the abundance of different gases at more than 200 sampling sites around the world.
Data from the IBTrACS database for more than 6,000 global tropical cyclones allows users to interactively study past hurricanes, looking at position, wind speed, and pressure.
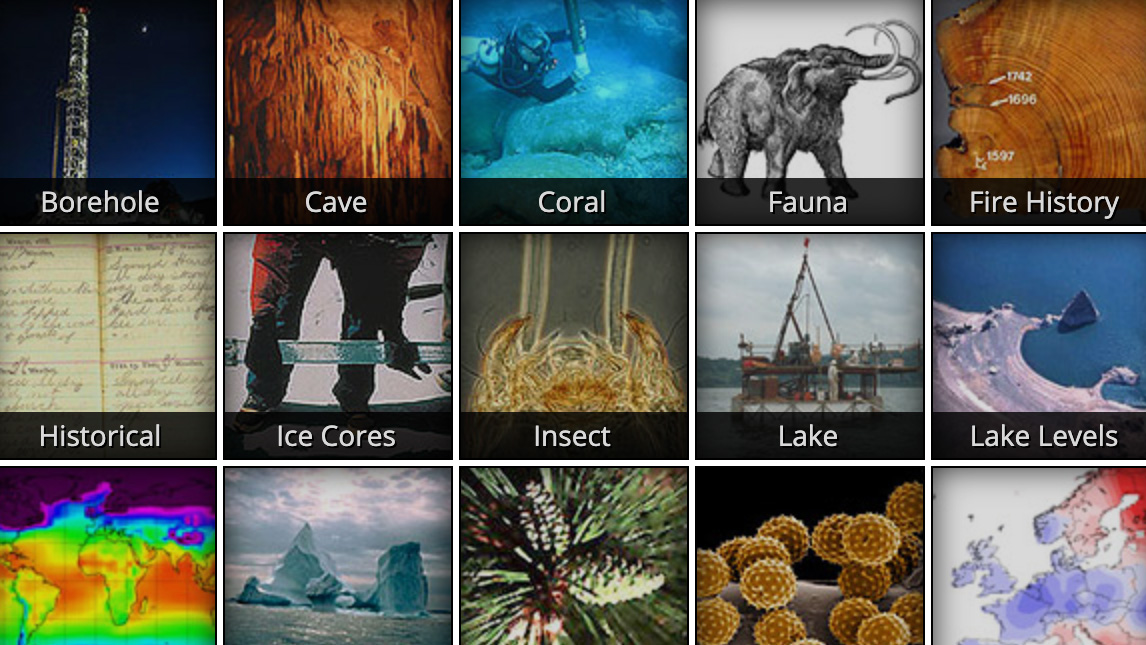
Access to paleoclimate records extending back thousands or millions of years, including descriptive information and explanatory notes, maps, searches, visualizations, and more.
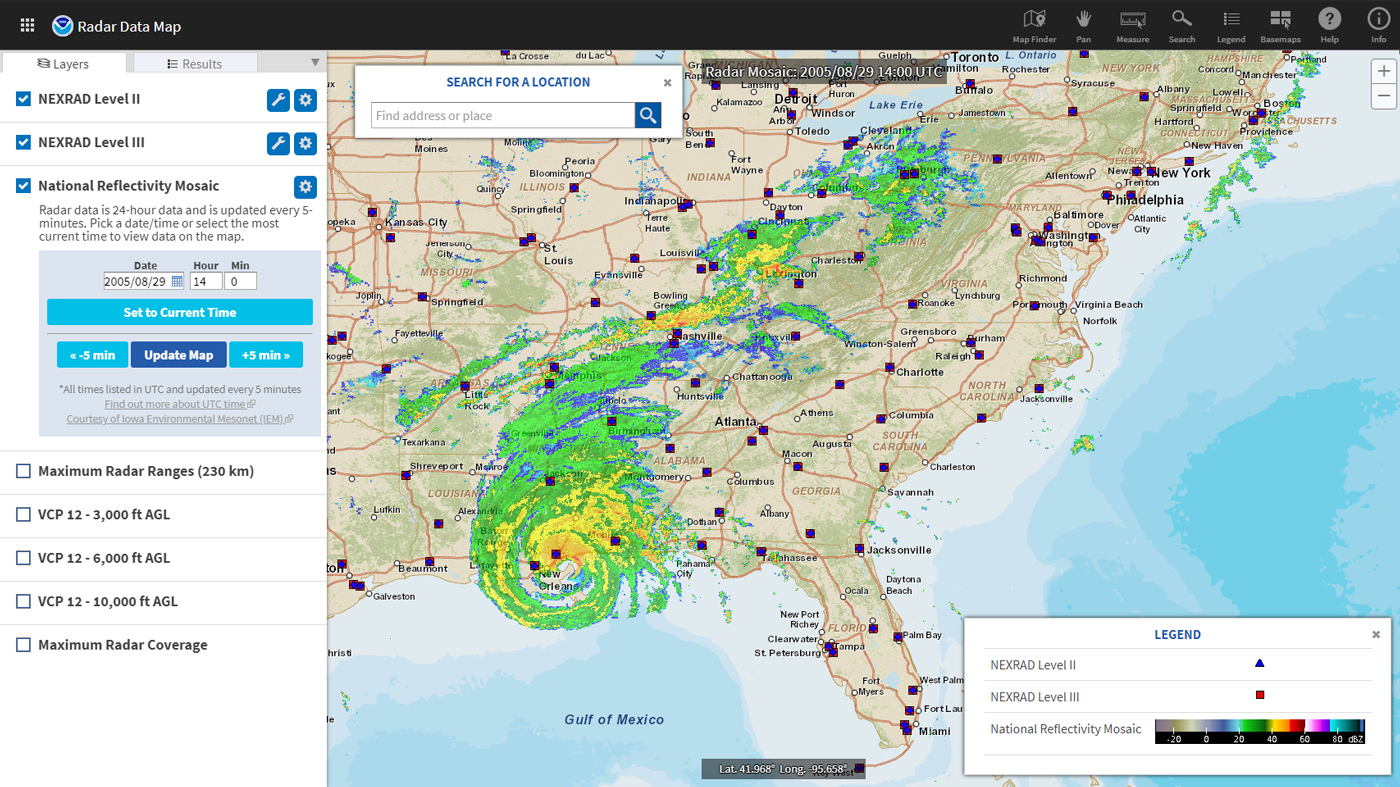
Radar technology enables weather observers to track rain and snow storms in real time.