ENSO Blog
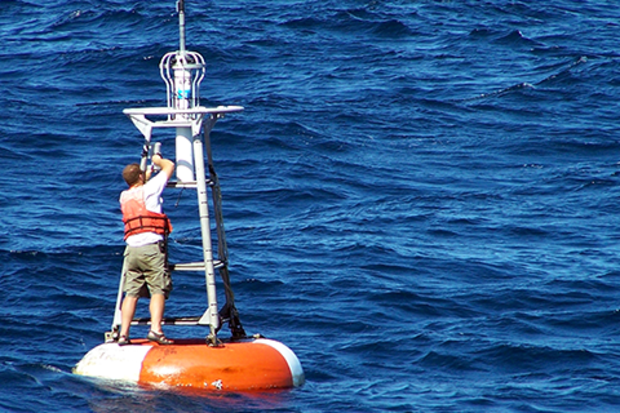
As Emily has painstakingly documented at the beginning of every month for what seems like an eternity, we have an El Niño event on our hands. And if you’ve read her posts religiously (which of course you have, because they are awesome), you already know that one way Emily shows the strength of El Niño is via the sea surface temperature (SST) anomalies in a region of the Pacific Ocean called the Niño3.4 region.
You may also have noticed that when we talk about how one event compares to another, we usually say something like, “Depending on what dataset you use….” Up until now, though we’ve haven’t talked much about how exactly we determine which sea surface temperature dataset to use to det…
Read article
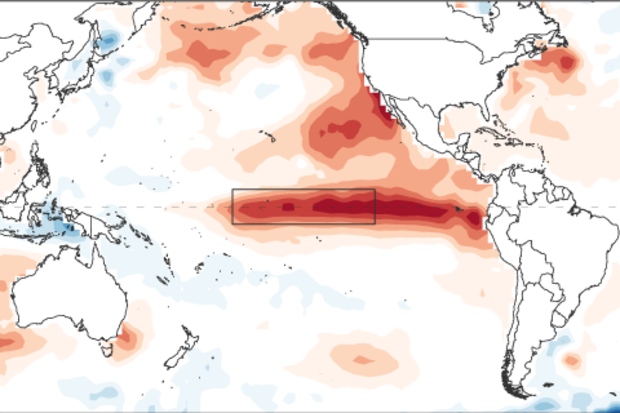
The peak of our current El Niño is expected to occur in the next month or so… but what does that mean? We measure El Niño events by how much warmer the surface waters in a specific region of the equatorial Pacific are, compared to their long-term average. The difference from average is known as the “anomaly,” and we use the average anomaly in the Niño3.4 region as our primary index for El Niño. When the index in this region is at its highest, we have our peak El Niño.
However, El Niño-related impacts have been occurring around the globe for months already, and will continue for several months after the warmest temperatures occur in the tropical Pacific Ocean. For example, du…
Read article
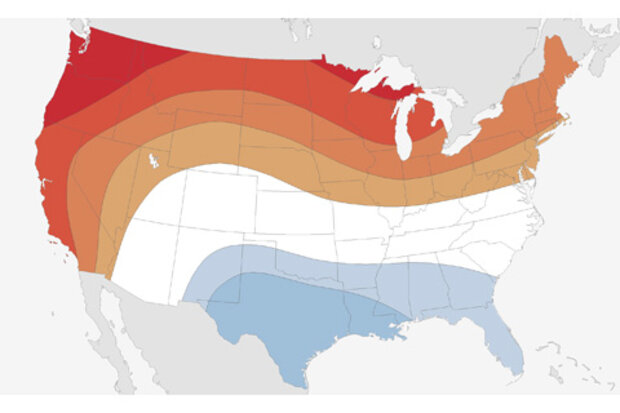
Four years of drought in California. Back-to-back cold and snowy winters over the Midwest and Northeast, while balmy in the West. What’s next, thunder, hail, or maybe locusts and frogs? Or will this winter bring more “normal” winter weather? Actually thunder and hail isn’t too far-fetched this winter, at least in the Southeast, but more about that later. The jury’s still out on the locusts and frogs. So what can we expect this winter?
Since this post is appearing on the ENSO blog, readers are well aware that El Niño developed last spring and is currently among the strongest events on record back to 1950. In addition, previous posts have discussed how El Niño can impact the weather and…
Read article
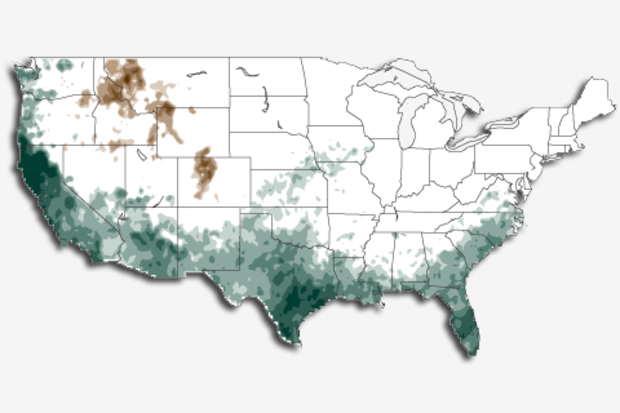
As we approach peak pumpkin spice latte season, we’re also closing in on the peak of the 2015-2016 El Niño, expected by forecasters to occur in the late fall or early winter.
This El Niño continues to rank among the strongest in our records, which start in 1950. The July-September 3-month average sea surface temperature (the ONI) was 1.5°C above normal, third in line behind July-September 1987 (1.6°C) and 1997 (1.7°C). The atmospheric response to the warmer-than-average sea surface temperatures is keeping pace, too: the Equatorial Southern Oscillation Index (EQSOI) is -2.2. This is second to 1997’s -2.6, and well ahead of the next two El Niños on the list (1972 and 1982, tied at -1.4).
…
Read article
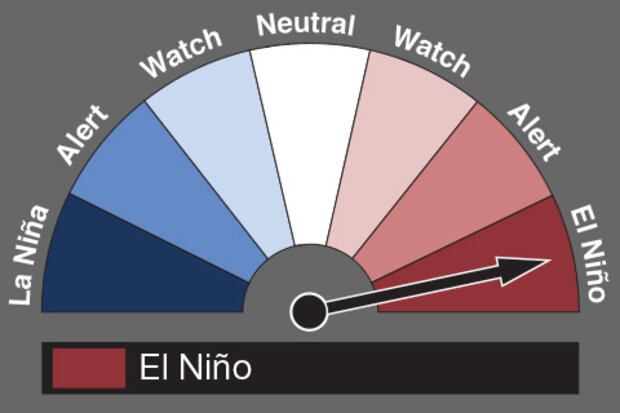
This is a guest post by Dr Andrew Watkins, Leader of the Climate Prediction Services team at the Bureau of Meteorology (BoM) in Australia. As well as releasing Australia's seasonal outlooks every month, the team write the BoM ENSO updates and communicate ENSO impacts for Australia. You can follow the Bureau of Meteorology on Twitter @BoM_AU.
Australia and the US share many things. They are roughly the same size, they both sit on the Pacific Rim, and their people love sports, music, and movies, plus the odd donut. But to a climatologist, there are a number of fundamental differences.
For a start, America is in the land-heavy Northern Hemis…
Read article